This is a guest blog from our friends at Dialpad.
Are you looking at developing and modernizing your business with the use of sales dashboards? You can use many different types of dashboards, depending on what data you want to show. We have found 10 of the most useful dashboards you and your team should familiarize yourselves with.
What is a Sales Dashboard?
A sales dashboard is a visual tool that helps you keep track of your data. Whether you are looking at the average time it takes to close a deal or how often your sales team is likely to queue a call, a dashboard can help. Data and analytics can be confusing. But a sales dashboard will show your data in a simple way that is easy to understand.
As a sales manager, you can use a sales dashboard to monitor the performance of your sales team. With the right dashboard, you can create a visual representation of your key sales metrics. Sales dashboards can also be helpful for teams to track their own progress.
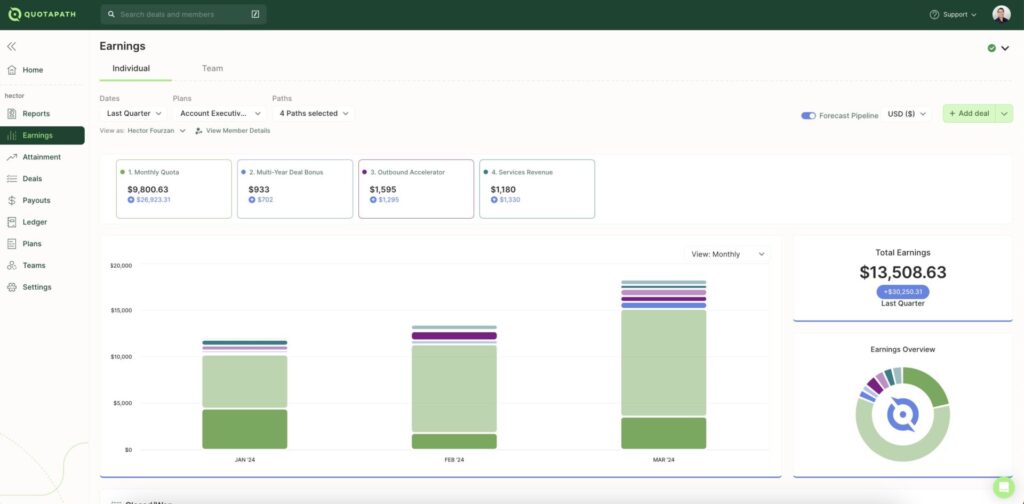
Real-time earnings dashboard
With QuotaPath, give your reps immediate insight into their existing and projected earnings based on their pipeline. Sync your CRM, like HubSpot and Salesforce, and trust the math is right.
Book a Demo10 Sales Dashboards To Familiarise Yourself With
1. Win/Loss Dashboard
A Win/Loss Dashboard shows the overall deals that were closed within a certain period of time. It also shows losses and open or pending sales. These dashboards are useful for tracking sales as they show strengths, as well as areas with room for improvement.
These dashboards are also useful for sales managers as they can track the performance of individuals within their team. Team performance can also be compared to previous periods to measure overall performance.
Why is a win/loss dashboard useful?
A win/loss dashboard is useful because it provides clear visibility into sales performance, showing which deals were won, lost, or are still pending within a specific timeframe. This helps sales managers identify patterns, strengths, and areas for improvement, allowing them to adjust strategies and coaching efforts accordingly. Additionally, it enables historical comparisons, helping teams track progress over time and refine their sales approach to improve win rates.
2. Sales Activities Dashboard
The Sales Activities Dashboard will help you learn more about what your employees do during the workday. This dashboard uses charts to show which sales activities are undertaken by each team member.
For example, if your company uses VoIP calling for its sales calls, you can analyze data, such as the duration of calls and the number of phone calls made to secure a sale. Using your dashboard, you can see which employees are more productive and how sales relate to the activities they are doing.
Why is a sales activity dashboard useful?
A sales activities dashboard is useful because it provides insight into how sales reps spend their time and which activities drive results. By tracking metrics like call volume, meeting frequency, and deal progress, managers can identify top performers, uncover productivity trends, and optimize sales strategies. This data-driven approach helps improve efficiency, coaching, and overall sales performance.
3. Time-Tracking Sales Dashboard
This dashboard is another way to track your sales team’s activities. But the Time-Tracking Sales Dashboard looks specifically at how much time is spent on each activity. This can be useful when looking for ways to increase productivity. If too much time is regularly spent on certain activities, you can look into ways to streamline that process.
Time-tracking can also be used to work out how much time is spent on individual clients. For example, to give a more accurate bill to clients who are charged by the hour.
Why is a time tracking sales dashboard useful?
A time-tracking sales dashboard is useful because it provides visibility into how much time reps spend on different sales activities, helping identify inefficiencies and opportunities for streamlining processes. By analyzing time allocation, managers can optimize workflows, improve productivity, and ensure reps focus on high-impact tasks. Additionally, it enables more accurate client billing for businesses that charge by the hour.
4. Product Performance Dashboard
A Product Performance Dashboard looks at the sales of individual products. This is very useful for keeping track of sales so you can create a realistic inventory projection. It should be easy for both your buyers and sales team to use and keep your business running smoothly
If sales have declined, a Product Performance Dashboard can help your team decide which lines to discontinue. It can also help build a bigger picture of trends in different periods. This keeps your business one step ahead with ordering in the future. This prevents surplus stock, selling out of stock too quickly, or bringing in new lines that will not sell.
Why is a product performance dashboard useful?
A product performance dashboard is useful because it tracks the sales of individual products, helping businesses manage inventory and make informed purchasing decisions. By analyzing trends over time, companies can identify which products to discontinue, adjust stock levels to prevent shortages or surpluses, and optimize sales strategies. This ensures smoother operations, better forecasting, and improved profitability.
5. Deal Performance Dashboard
If you want to focus your dashboard on sales forecasts, you need to look into Deal Performance Dashboards. These dashboards use data from previously closed deals and current ongoing deals to predict sales for the upcoming year.
This dashboard is also suitable for analyzing the different stages of the deal process. You can track changes to ongoing deals, as well as how many deals each of your sales team has closed in each period.
Why is a deal performance dashboard useful?
A deal performance dashboard is useful because it analyzes past and current deals to forecast future sales, helping businesses set realistic revenue goals. It also tracks deal progression through different sales stages, allowing sales managers to monitor performance trends, identify bottlenecks, and optimize sales strategies. This ensures better pipeline management and more accurate sales planning.
6. Sales Manager Dashboard
This is the dashboard that every sales manager should familiarize themselves with. With this, they can look at day-to-day sales performances, or monitor them weekly, monthly, and yearly. They can use this information to manage their teams more effectively.
A Sales Manager Dashboard ensures that managers can keep track of targets. They can see how their team is progressing and make adjustments if they are not. Larger companies can also track their sales regionally. Being able to analyze regional sales gives managers the ability to measure performance better.
Why is a sales manager dashboard useful?
A sales manager dashboard is useful because it provides a clear view of sales performance over different time periods, helping managers track targets and adjust strategies as needed. It also enables regional sales analysis, ensuring better team management and performance measurement.
7. Sales KPI Dashboard
Key Performance Indicators (KPIs) are goals set by a company to measure its performance. But if you want a clear, concise way to analyze your KPIs with your team, you should create a Sales KPI Dashboard.
The Sales KPI Dashboard should be accessible to the whole team so that they can keep track of their own progress. You can use it during meetings to show areas to work on, give feedback, and help with training.
Why is a sales KPI dashboard useful?
A sales KPI dashboard is useful because it provides a clear, real-time view of key performance metrics, helping teams track progress toward goals. It also facilitates data-driven coaching and feedback, ensuring continuous improvement and alignment with company objectives.
8. Sales Cycle Length Dashboar
A Sales Cycle Length Dashboard is used to monitor how long sales take, from identifying a lead to closing the deal. This dashboard is ideal for teams looking to shorten their sales cycles. You can also look at average sales cycle lengths over certain periods.
Your team can monitor exactly which parts of the sales are more time-consuming and which parts can be easily streamlined. You can also analyze individual team members to see if they have found a better process that the whole team can utilize.
Why is a sales cycle length dashboard useful?
A sales cycle length dashboard is useful because it tracks how long deals take to close, helping teams identify bottlenecks and streamline processes. It also allows managers to analyze trends and optimize strategies for a more efficient sales cycle.
9. Sales Conversion Rate Dashboard
A team’s sales conversion rate is how well it converts leads into paying customers. Your sales team may be getting a lot of leads but struggling to follow them through to close a deal. Alternatively, you may be getting fewer high-quality leads with a higher conversion rate.
If you are keen to increase your sales rates, this is the dashboard for you. It can highlight your lead-to-sales ratios, as well as loss rates. A Sales Conversion Rate Dashboard will give you a clearer look at the bigger picture.
How is a sales conversion rate dashboard useful?
A sales conversion rate dashboard is useful because it measures how effectively leads are converted into customers, helping teams identify strengths, weaknesses, and opportunities to improve sales processes.
10. Sales Opportunity Dashboard
If you are looking to expand your business and build on your sales, you need to look at the Sales Opportunity Dashboard. You can monitor how new customers and sales channels will increase your revenue, as well as identify challenges.
For example, is your sales team using all the resources available to them? A potential customer may have a query a call operator can’t answer. Are they using call transferring to redirect the customer to a colleague who will be able to help? Or do they regularly keep customers on hold while they look for answers?
Why is a sales opportunity dashboard useful?
A sales opportunity dashboard is useful because it tracks potential revenue growth by analyzing new customers, sales channels, and team effectiveness in handling opportunities. It helps identify gaps in the sales process, ensuring teams maximize available resources and improve customer interactions to close more deals.
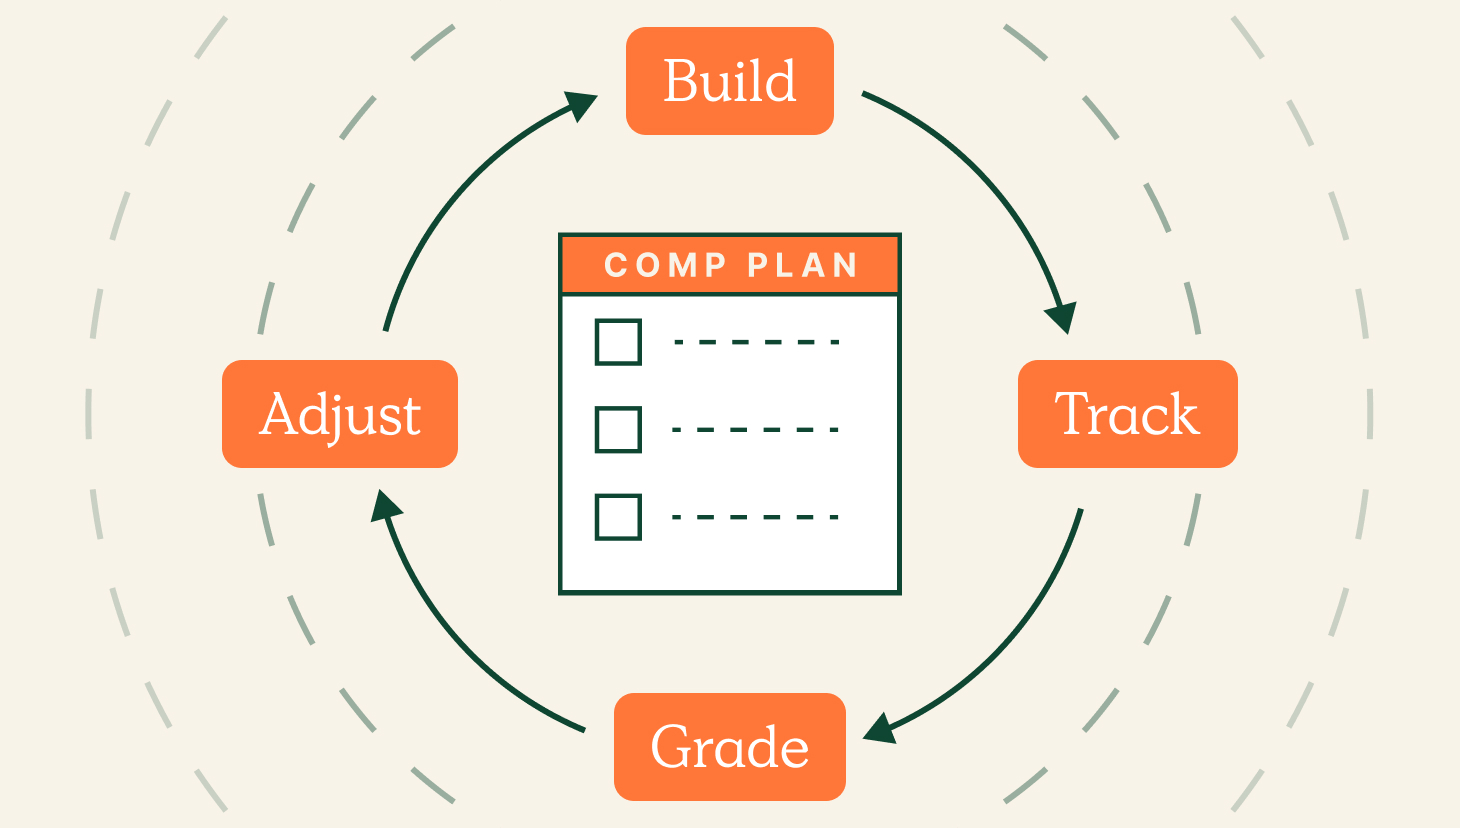
RevOps, sales leaders, and finance teams use our free tool to ensure reps’ on-target earnings and quotas line up with industry standards. Customize plans with accelerators, bonuses, and more, by adjusting 9 variables.
Build a Comp PlanHow to Create Your Sales Dashboard
- Establish why you want to create a sales dashboard: Are you making it to track sales, monitor employees, or is there a specific problem you want to address?
- Decide what sales metrics you will be tracking: There’s no one-size-fits-all dashboard, so you need to know exactly what data you want to show.
- Choose your dashboard: There are many dashboards to choose from, so make sure you are choosing the correct one for your purpose.
- Decide how you want to use the sales dashboard: Your dashboard will be different depending on what it will be used for, who will be using it and what period it covers. You may want to simplify it if your whole sales team needs to use it.
- Choose a sales provider (or do it yourself): If you have the know-how, you could create your dashboard yourself using Excel. But if you don’t have the technical skills to make one yourself, there are many sales tools to choose from
Some examples of popular sales data software providers are Klipfolio, Zoho Reports, Hubspot CRM, and Salesforce.
- Create your reports: If you are using a sales provider, you just need to input the information, and everything will be put together for you. But you will still need to choose how you want your sales dashboard to be laid out. If you are creating it yourself, you will need to create your own charts and graphs.
- Keep it simple: This is not the time for overdesigning. Choose a clear layout that is easy to read. You need to think about how the sales dashboard will be accessed. Will employees use their phones, laptops, or desktop computers? Can the sales report be seen clearly on small and larger screens?
Metrics to Include in Your Sales Dashboard
A well-designed sales dashboard provides a clear snapshot of your team’s performance, helping you track progress, identify opportunities, and optimize sales strategies. Below are key metrics to include and why they matter.
Win Rate: The percentage of closed deals compared to total opportunities. A high win rate indicates strong sales execution, while a low rate may signal issues in qualification or closing techniques.
Sales Conversion Rate: The percentage of leads that convert into paying customers. This helps measure lead quality and the effectiveness of your sales process.
Quota Attainment: The percentage of quota achieved by individual reps or teams. This metric shows how well sales targets are set and whether reps need additional support or incentives.
Average Deal Size: The average revenue per closed deal. Tracking this helps businesses optimize pricing strategies and identify trends in customer purchasing behavior.
Sales Cycle Length: The average time it takes to move a lead from initial contact to closed deal. Shorter sales cycles generally indicate a more efficient sales process.
Pipeline Value: The total value of all deals in the pipeline. This provides insight into potential future revenue and helps with forecasting.
Customer Acquisition Cost (CAC): The total cost of acquiring a new customer, including marketing and sales expenses. Lowering CAC while maintaining high conversion rates improves profitability.
Churn Rate: The percentage of customers who stop doing business with you over a given period. High churn indicates potential issues with customer satisfaction or product fit.
Lead Response Time: The average time it takes for sales reps to follow up with a lead.
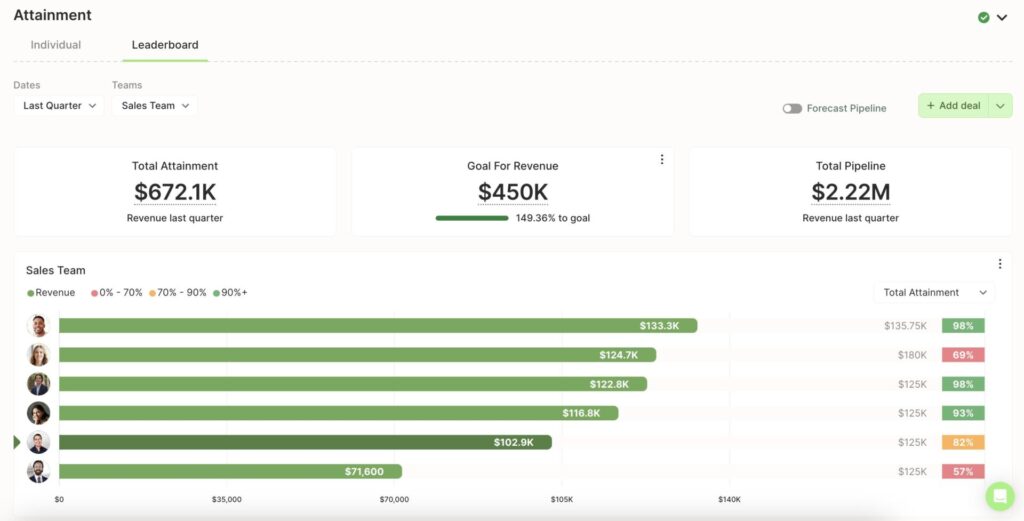
Sales Dashboard Examples
The following our sales dashboard examples available in QuotaPath and through our key integrations.
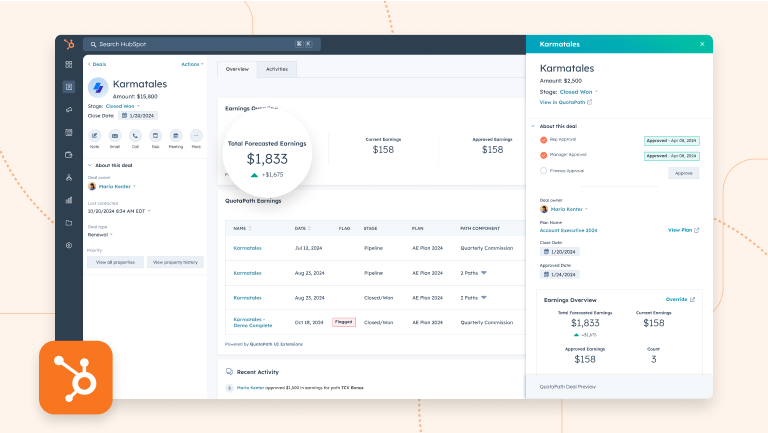
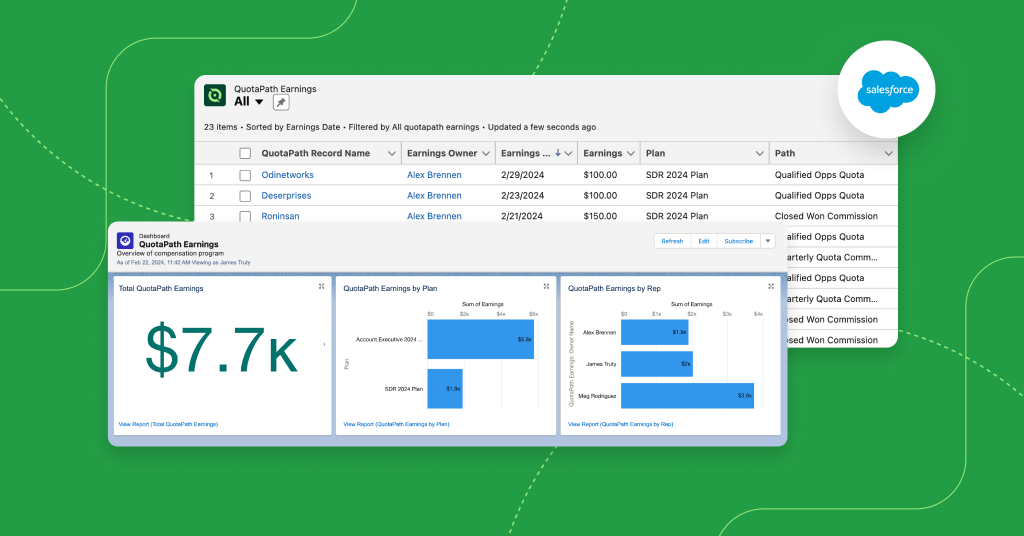
Your Sales Dashboard
Sales dashboards are a visual tool to enhance your business. It’s not just about data. Dashboards assist with employee communication, reaching targets, and finding problems as they arise. You should be asking yourself exactly what you want from your sales dashboard.
Keep your dashboard simple, clean, and clear. It should be easy to read and interpret by anyone on your sales team. Don’t worry about pretty colors and overcomplicated graphs. Make it accessible to everyone.
The most important thing to think about when creating your sales dashboard should be whether it is user-friendly. A sales dashboard is an example of modern data architecture, meaning it should be designed and structured well. It should be a reliable way to access and process data.
About the author: Jenna Bunnell, Senior Manager, Content Marketing, Dialpad
Jenna Bunnell is the Senior Manager for Content Marketing at Dialpad, a call recording software and AI-incorporated cloud-hosted unified communications system that provides valuable call details for business owners and sales representatives. She is driven and passionate about communicating a brand’s design sensibility and visualizing how content can be presented in creative and comprehensive ways. Check out her LinkedIn profile.