The key to success in sales is having a flexible, well-considered strategy in which every member of your organization has a part to play. But regular sales reports prevent even the best strategies from suffering setbacks and help you hit long- and short-term targets.
Analyzing sales data through periodic reporting is the simplest yet most effective tool for monitoring progress, identifying areas needing improvement, and determining where the latest technological and organizational solutions can fit into your operations.
Below, we’ll look at the basic process of writing sales reports and a few types of reports that may help you achieve your goals. Let’s get started.
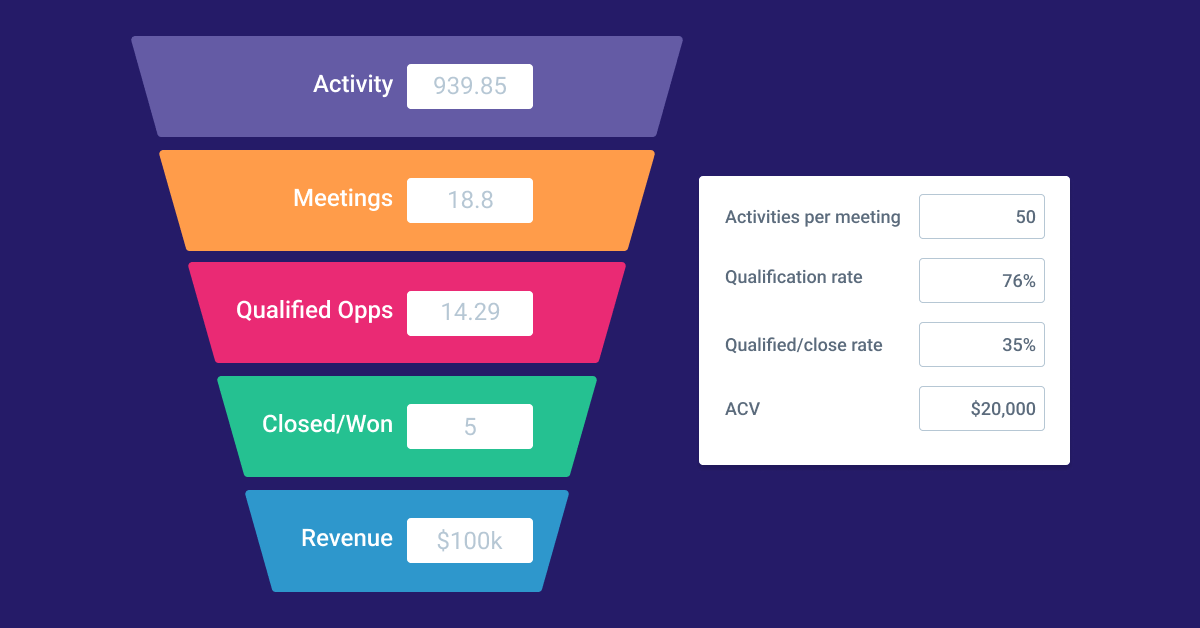
Build a Sales Funnel
Use our free sales funnel resource to see how many meetings your team needs to book to hit quota.
Calculate NowWhat is a sales report?
A sales report outlines a comprehensive overview of a company’s sales performance over a specific period. Reports can measure daily, quarterly, or annual sales. They’re typically used to evaluate sales performance, identify opportunities for improvement, and make informed business decisions.
Sales reports may include key performance indicators (KPIs), such as sales by region, customer segmentation, sales pipeline, conversion rates, and revenue forecasts. More complex or specific reports can include information that may impact sales, such as contact center automation trends, team performance evaluations, or marketing campaigns.
Team leaders or sales managers are usually tasked with writing these reports, incorporating data and analysis related to sales activities, revenue generated, products or services sold, customer trends, and other relevant metrics. Sales reports are valuable for monitoring progress, setting targets, and developing strategies to drive sales growth and achieve organizational goals.
How to write standout sales reports in 6 simple steps

There are many types of sales reports (more on that later), each with specific factors to consider when creating one. Regardless of the type, the general process is the same. These are the basic steps.
1. Determine your objective
First, determine the purpose or objective of your sales report. It could be to evaluate sales performance, track progress towards sales targets, identify areas for improvement, or provide insights for strategic decision-making. For example, if you’re trying to demonstrate the benefits of a new insurance lead gen campaign, you may want to track the number of leads generated and gather data giving you an idea of how many turned into sales calls and, ultimately, conversions.
Defining the objective helps ensure that the report is focused and provides relevant information. It will also help you to determine whether you achieved your initial objective once you’ve finished the report.
2. Identify your audience
Once you’ve determined why you’re writing your report, it’s time to decide who to write it for. Consider who will be reading the sales report. Identify the stakeholders, such as sales managers, executives, or team members, and anticipate their needs and expectations. Adapt the report’s tone, level of detail, and format accordingly to effectively communicate with the intended audience.
3. Select a time period
Determine the time frame that the report will cover. It could be daily, weekly, monthly, quarterly, or annually, depending on the frequency of data collection and the reporting needs of your audience. As a rule, daily and weekly reports are less detailed and more concerned with factors like the average number of outbound calls per rep, sales commissions, or short-term sales performance. Monthly or quarterly reports cover the number of deals closed and organization-wide performance.
4. Gather the data
Gather all the relevant data required for the sales report. This could include sales figures, revenue data, customer information, or product or service performance. Ensure the accuracy and completeness of the data by verifying it from reliable sources.
You may need to gather information from several sources, including sales software, remote devices, sales software, CRM tools, and your sales team. This data can be collected in a central database for convenience and easily accessed to produce regular sales reports for management, investors, and other stakeholders.
5. Select key metrics

Determine the key performance metrics that align with your objective and audience. These metrics could include total revenue, units sold, average deal size, conversion rates, customer acquisition, retention rates, or any other sales metrics. Select a combination of quantitative and qualitative metrics that offer a comprehensive view of the sales efforts.
6. Choose engaging visuals and publish
Present the data in a visually appealing, organized manner. Use charts, graphs, and tables to visualize the data and make it easier to understand and interpret. Choose visuals that align with the objective and resonate with your audience.
Select standout pieces of information — like a significant sales target reached due to the effort — and present them in callout boxes or alongside engaging imagery to make them more impactful and memorable.
Once the report is finalized, publish it in a suitable format, such as a PDF or shared document, for easy distribution and reference. Alternatively, if you plan on making reports public, you can set up a new site using Only Domains to share your findings with stakeholders. Your new page can serve as a repository of sales metrics for easy access and referencing.
Free Sales Commission Calculator Template
A free spreadsheet to simplify the commission tracking process. Track what you or your team have earned in 4 inputs.
Download Now5 types of sales reports
Sales pipeline reports
A sales pipeline report is a visual representation of a potential customer’s stages during the sales process. It provides an overview of the sales opportunities at each stage, from initial contact to final closure.
For example, if you’re trying to sell the latest payroll processing software, a pipeline report might measure the rate at which prospective customers turn into qualified leads, generating more revenue. It may also highlight which industries seem most interested in payroll software and tend to convert.

The report typically includes information about the number and value of deals and the probability of closing each opportunity. A sales pipeline report helps sales teams and managers track the progress of deals, identify potential bottlenecks or areas of improvement, and forecast future sales revenue.
In a sales pipeline report, opportunities are typically organized into different stages: prospecting, qualification, negotiation, and closing. Each opportunity is assigned a probability of success based on its current stage and the historical conversion rates of deals at that stage. The report allows sales teams to prioritize their efforts, focus on high-value opportunities, and allocate resources effectively.
Won and lost deals analysis reports
These reports systematically analyze the deals won by the company and those lost, providing valuable insights into the sales process and overall performance. They typically include key metrics such as the percentage of deals won versus lost, average deal size, the average length of deals, and the average duration of sales cycles for both won and lost deals.
This report aims to uncover trends and patterns that may explain the differences between won and lost deals. It explores factors such as the reasons for winning or losing the deal, the competition faced, the effectiveness of the sales strategy, the product or service offering, pricing, negotiations, and customer satisfaction.
By examining these factors, companies can identify their strengths and weaknesses. That enables them to make informed decisions on improving their sales process, increase win rates, and drive revenue growth.
Sales call reports

A sales call report is a detailed record of interactions made by a salesperson with customers or prospects during sales calls or meetings. It provides an overview of each call’s activities, discussions, and outcomes. These reports aim to determine whether sales staff are meeting sales targets and, if not, to determine why.
Sales call reports can also illustrate the effectiveness of your current sales call strategy. For instance, declining sales rates in your outbound team area could alert you to the need for an innovative solution, such as selecting the best power dialer to keep your call center competitive. It can also help you pinpoint strategies that are working effectively.
Average deal size reports
Average deal size reports cover insights into the typical monetary value of sales deals closed by your team. Their biggest benefit is in predicting revenue based on current sales patterns. This is a critical source of information for determining where to take your sales strategy in the future.
If, for example, you set a sales target of $250,000 per sales representative per quarter and the average deal value is about $5,000, you’ll see that each representative needs to close at least 50 deals in a given quarter. This is a great tool for giving your team clear on-the-job performance guidelines within the report’s specified period.
Conversion rate reports
A conversion rate report analyzes the proportion of sales leads or opportunities that result in a completed sale. They typically include detailed statistics such as the number of potential opportunities, the number of actual conversions, and total conversion rates.

Conversion rate reports may also delve deeper into specifics, showing conversion rates by product, region, sales representative, or other factors. Monitoring these metrics can yield insight into the outcomes of sales strategies and areas in need of improvement. It can also help you determine which sales tactics have higher conversion rates.
Design, track, and manage variable incentives with QuotaPath. Give your RevOps, finance, and sales teams transparency into sales compensation.
Talk to SalesGain a competitive edge with effective sales reports
So there you have it: the basic process of writing sales reports and a few of the more common types. Adopting the best sales reporting tactics and practices can go a long way toward making your company more competitive. But investing in the best resources and personnel is also important, from cloud-based dialer software to specialized lead generation experts.
Find out more about what Convoso offers to help you achieve your sales goals. Sign up for a free demo today.