Who?
300+ people working on Sales, Revenue Operations, and Finance teams
In August 2022, we surveyed more than 300 leaders and sales reps to get a pulse on today’s sales compensation trends.
With 38 questions around sales commissions structure, ownership, and rep motivation, we uncover how most organizations are thinking about sales compensation and where they struggle the most.
Below, we share our biggest takeaways. Get a downloadable PDF version of this page.

300+ people working on Sales, Revenue Operations, and Finance teams
38 questions about compensation plan structure, ownership, and rep motivation
Sales compensation drives revenue and is pivotal for hiring and retaining top talent
There's a lack of trust in sales compensation across Sales, Ops, and Finance


Discover, compare, and customize
Choose from 20 of the most used comp plans and customize 9 variables to align with your business
Saas
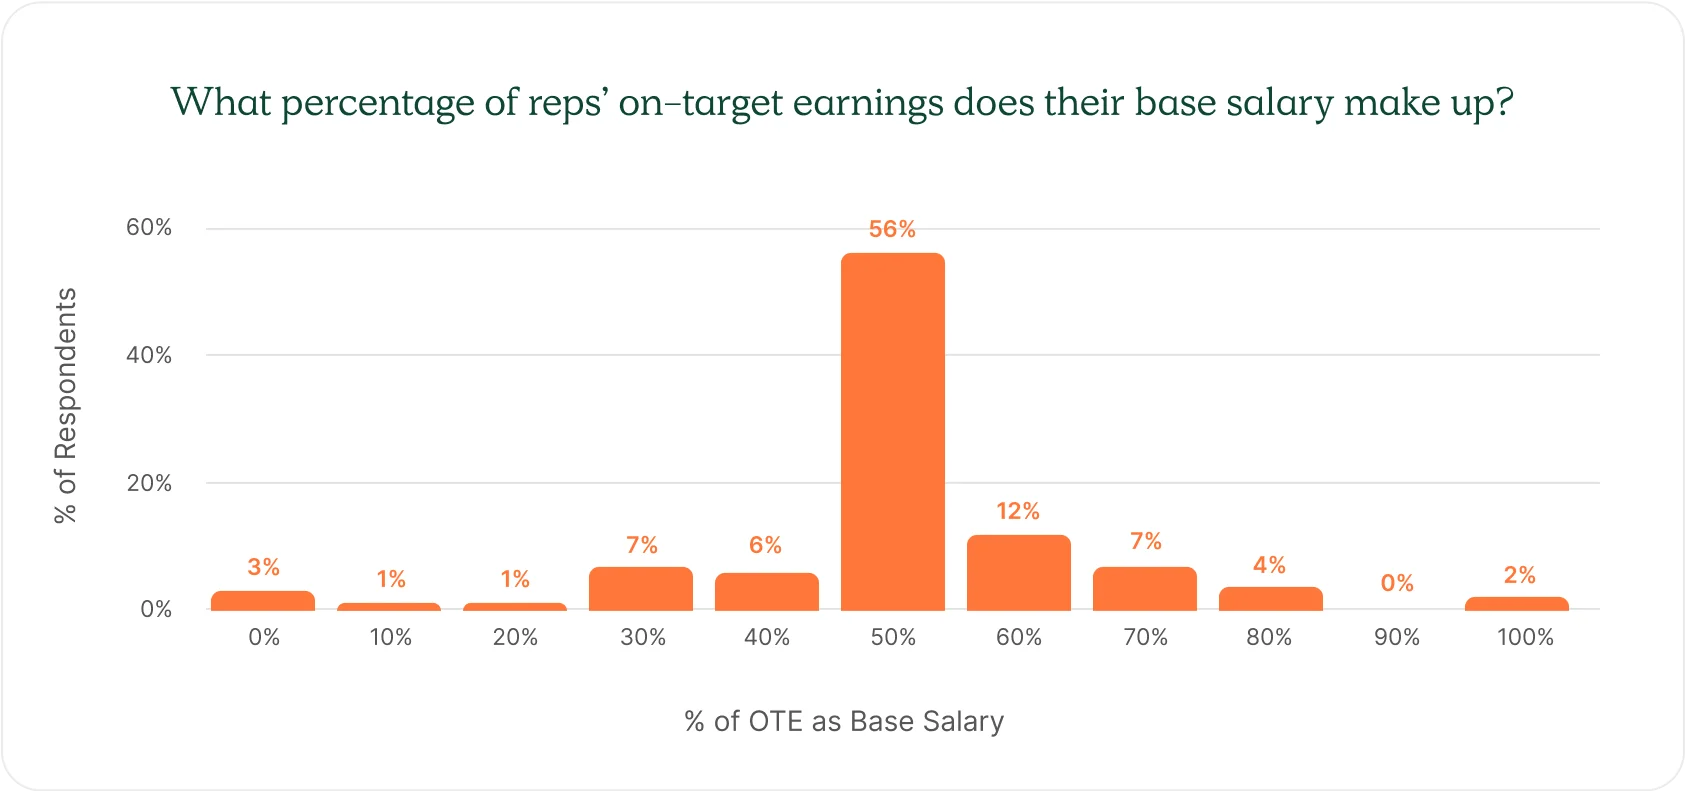
50% of OTE
Quarterly
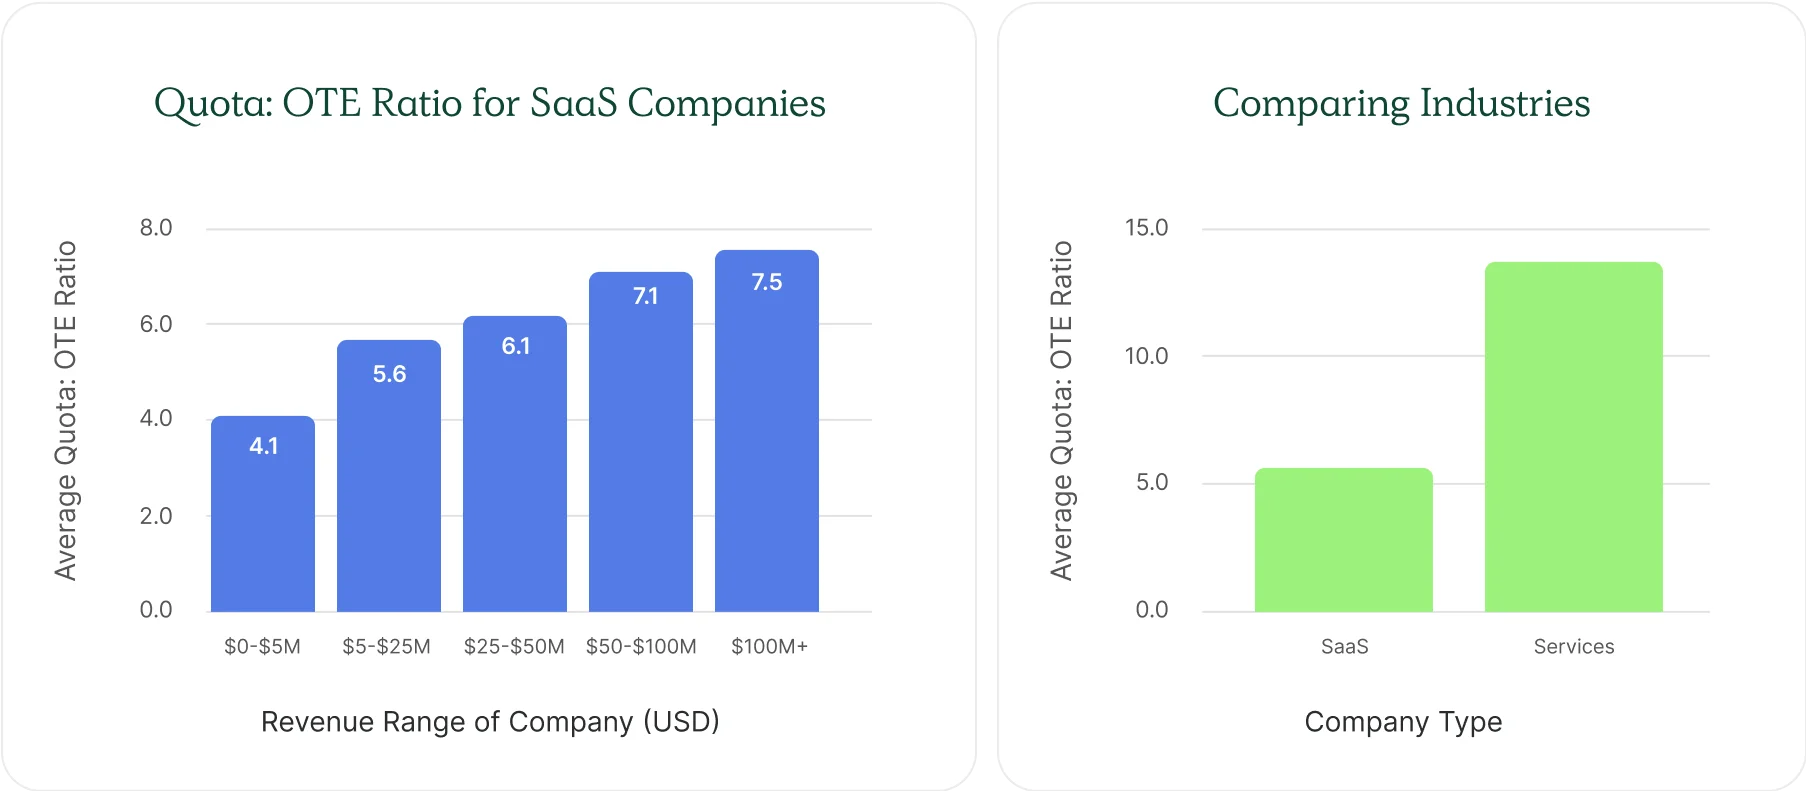
ARP & 4-7x OTE
Accelerators & Decelerators
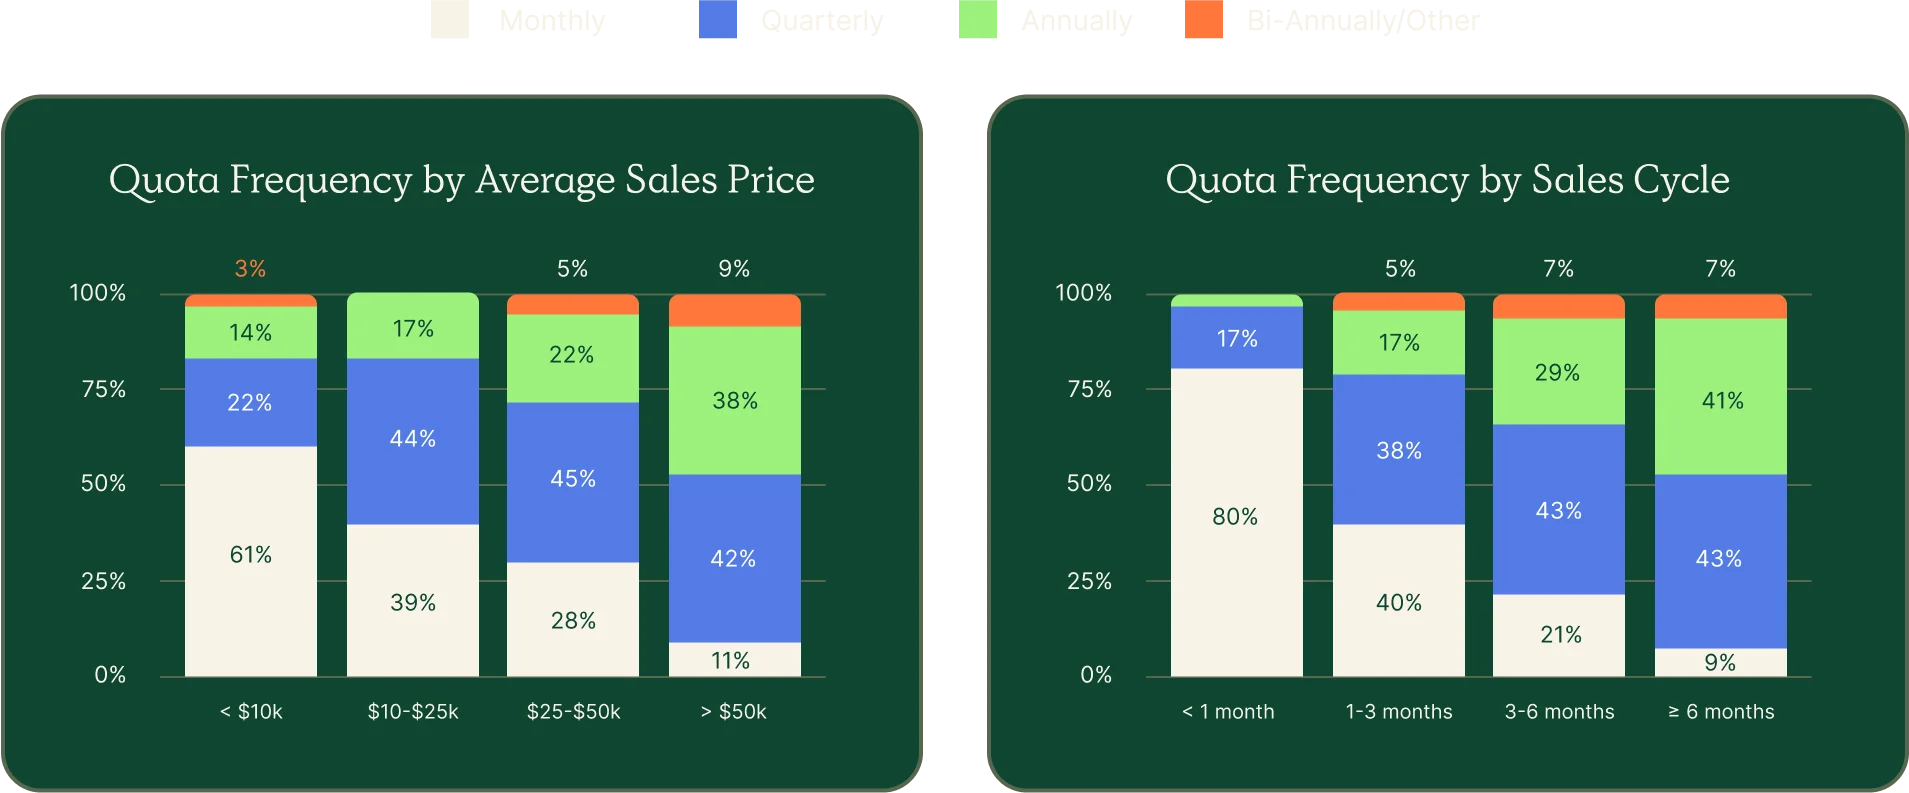
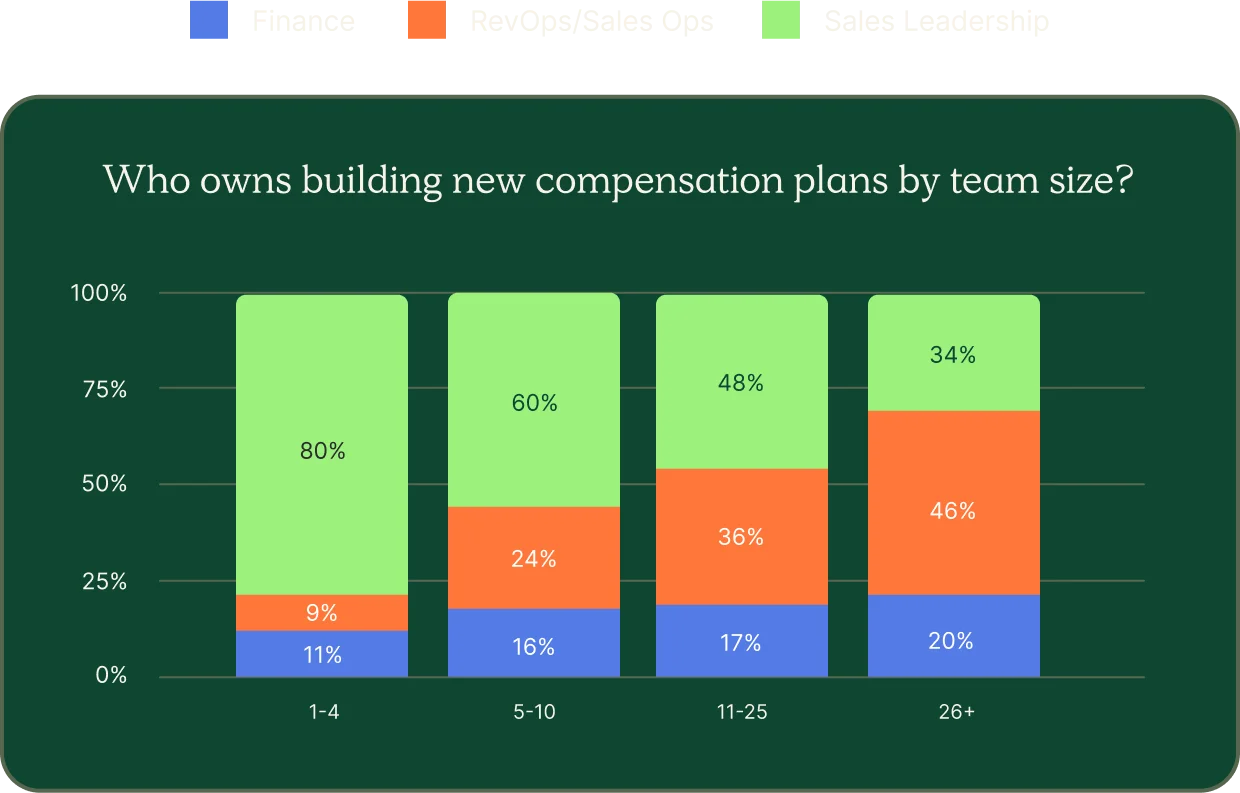
Sales Leadership creates comp plans at early stage organizations while RevOps leads the design at later stage companies. In both cases, they introduce new plans most often on a yearly basis.
Your plan should reflect your business, so if your sales cycles, revenue, and maturity curves don’t follow suit with another organization’s, then your comp plan shouldn’t follow either.
That’s a 17% increase from 2020
What to know when you’re building new compensation plans…
When you standardize, everyone with the same quota has the same earning potential. You standardize your sales commission structure, including the commission rates, bonuses, and OTEs.
“If you have different plans for each person on your sales team, you end up underpaying women and people of color,” said Graham Collins, our Chief of Staff.
Our VP of Sales Caroline Tarpey agreed. “People crave transparency in our organizations. When we standardize these, we’re giving that equitable opportunity to the team,” said Caroline.
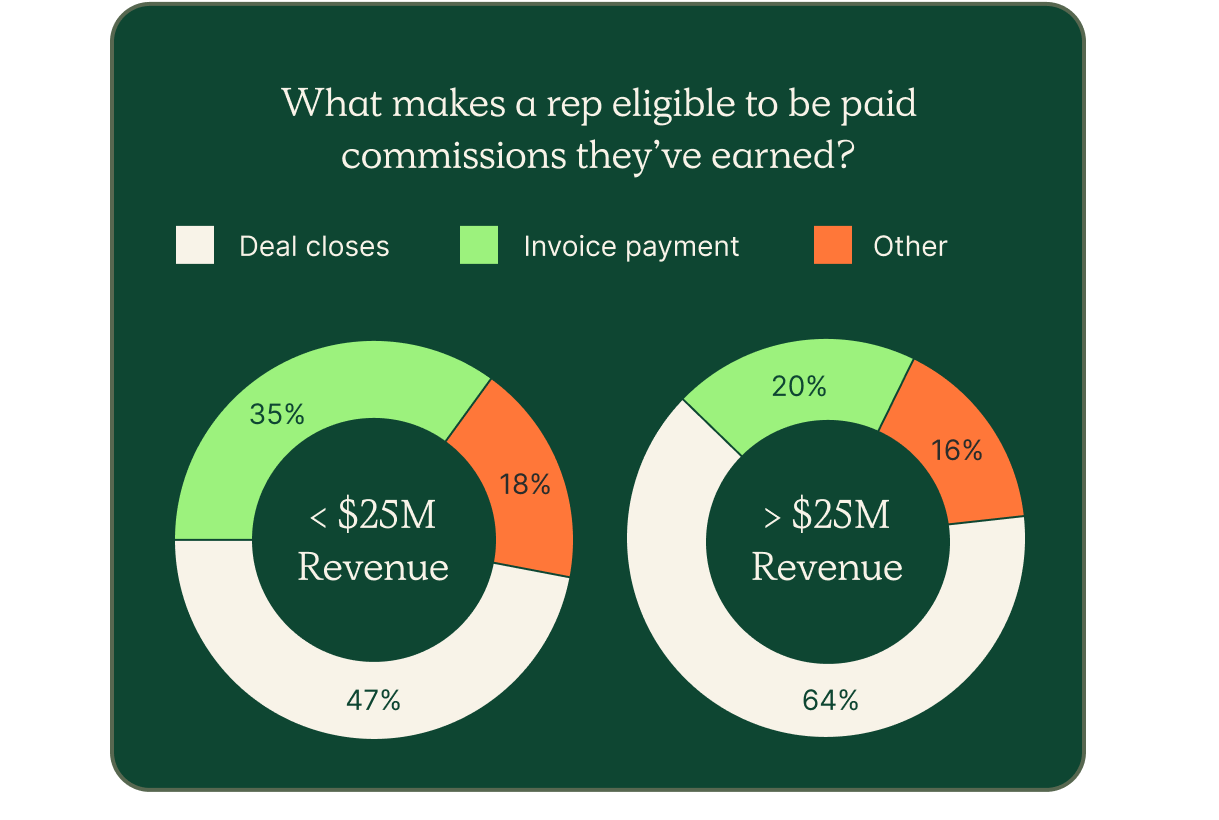
The more revenue a company makes, the quicker reps get paid.
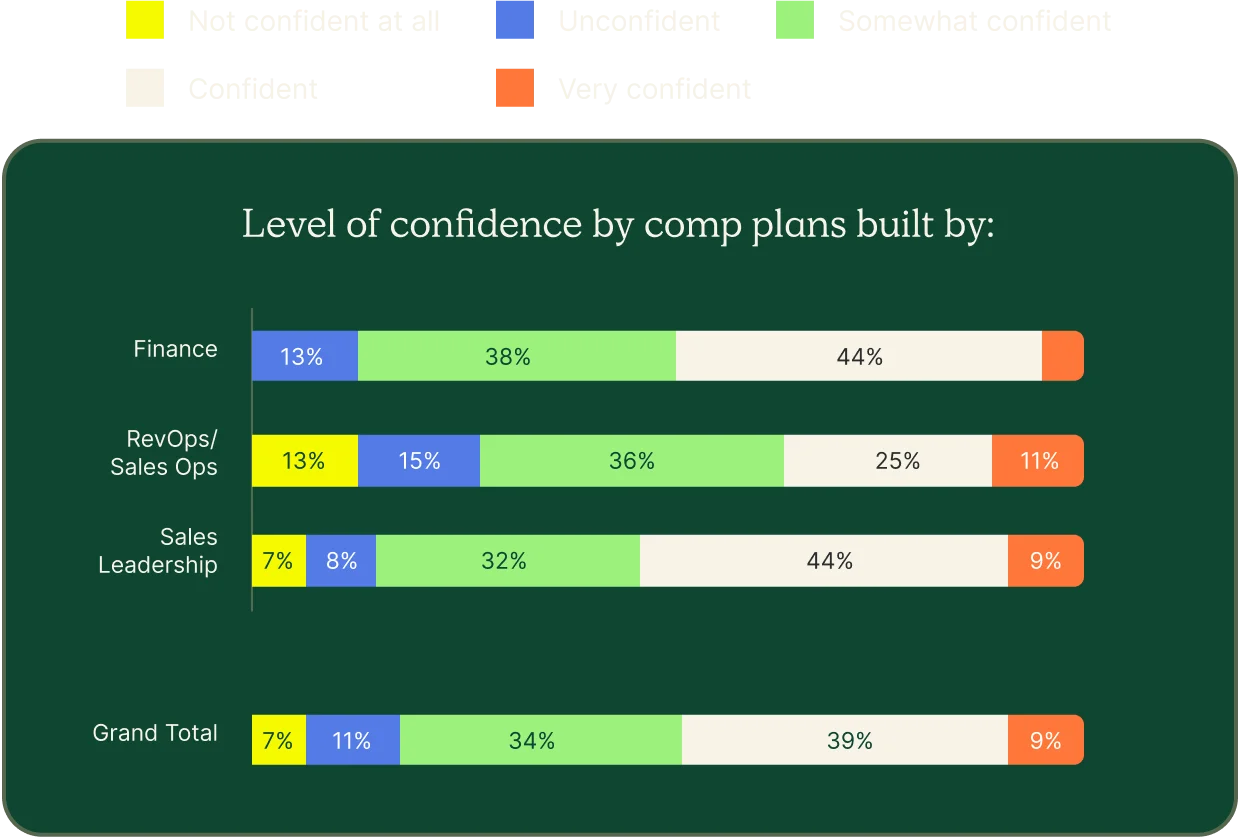
What is surprising, however, is the downward trend of reps lacking trust in plans built by RevOps. For instance, in a survey we conducted in 2020, reps had the most confidence in the plans RevOps created.
This shift, albeit small, tells us that RevOps can do a better job gaining the trust of their reps by collecting feedback from their sales teams. Our Senior Director of RevOps Ryan Milligan, for examples, hosts monthly one-on-ones with every member of the sales organization to check in.
No matter which department runs compensation planning, remember to keep your reps in the loop on future comp plan changes.
Ask for feedback, and explain the math and the reasoning behind the different mechanics of the plan. Most importantly, share how the company will help them reach their targets.
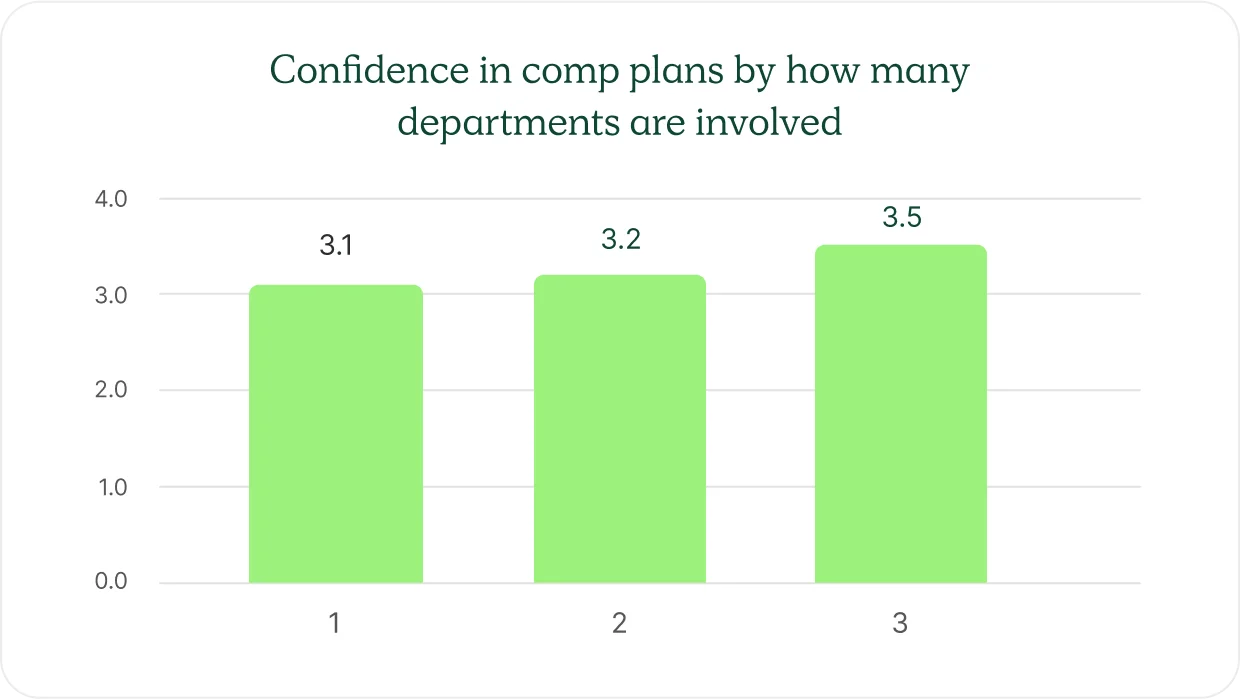
One of the surefire ways to increase trust in comp plans is to involve other departments with different perspectives. But make sure you don’t have a “too many cooks” problem by limiting input to 5 stakeholders.
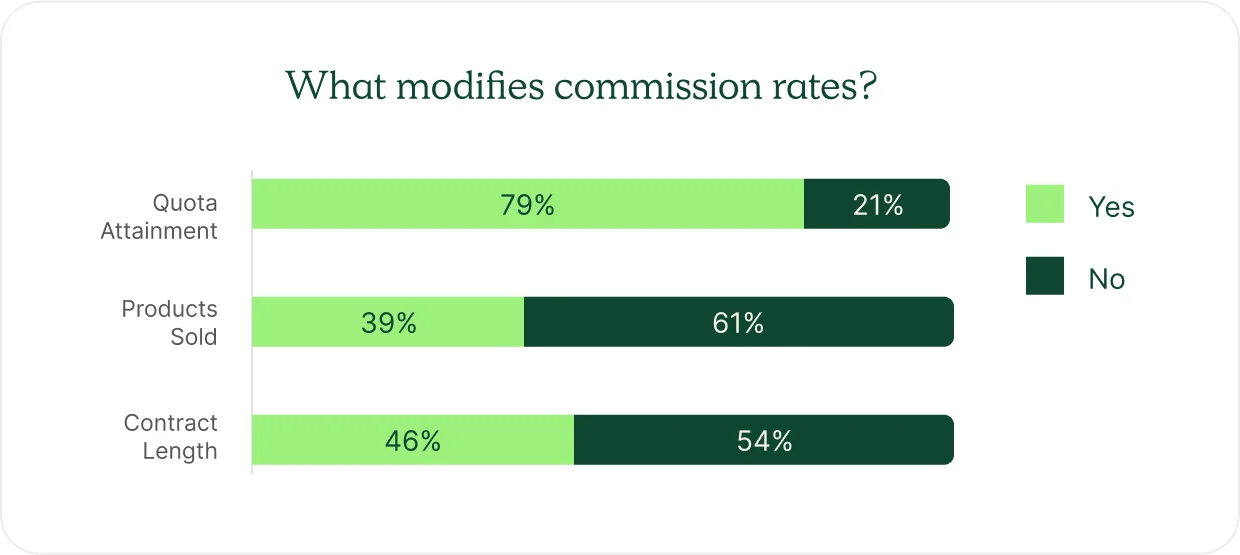
Quota attainment tiers are the most popular comp plan accelerator, followed by multi-year multipliers.
What to do?!
What it takes to build confidence in compensation…
In our experience, we see leaders issue more comp plan changes during market volatilities, uncertainties or changes to sales cycles and pricing, and shifts in strategic business objectives.
One way to get ahead of those changes, and foster trust along the way, is to come up with the business goals first, then leverage the comp plan to drive those. That means if your company introduces a new product while sunsetting another, your comp plan should pay enough on the new product to motivate reps to sell that over the existing one.
Setting expectations from the onset will also establish trust. If you think you’ll have to modify your plans throughout the year, be upfront with your reps to avoid blindsiding them later. For help rolling out changes, check out this example compensation communication plan.
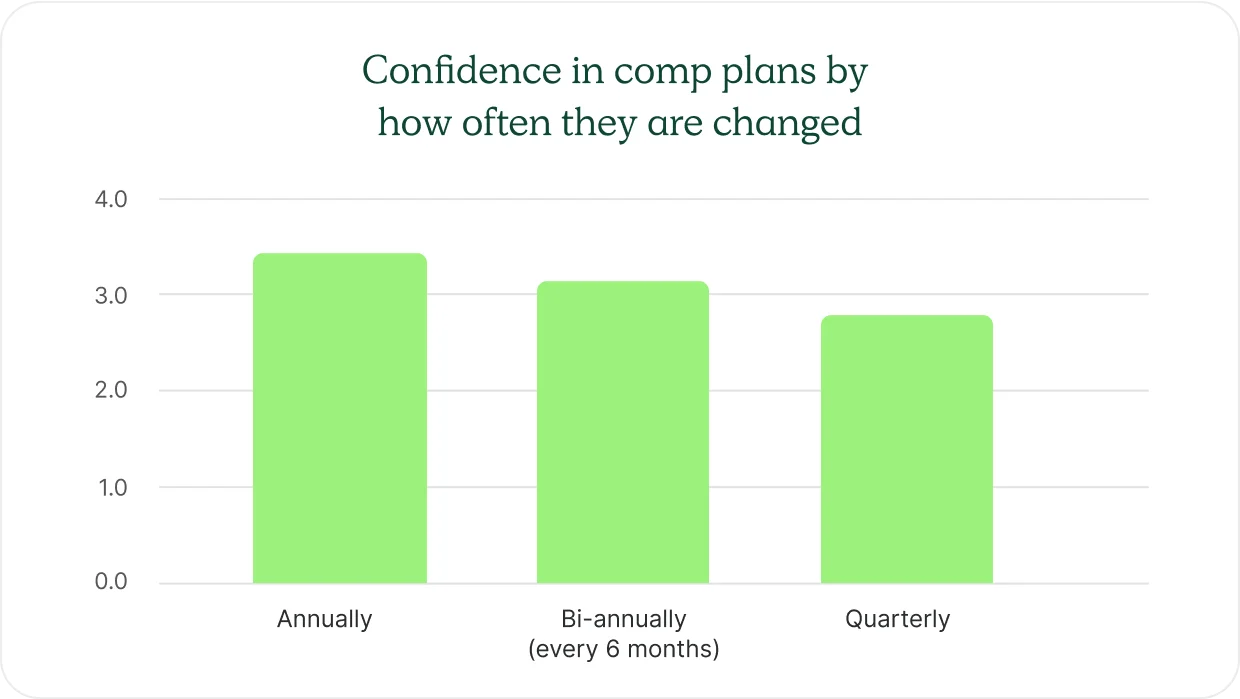
By constantly changing your compensation plans, you’re communicating that you aren’t confident in the plan. Build it right the first time and stick with it.
Reps are rightfully wary. 80% of companies pay sales reps wrong.
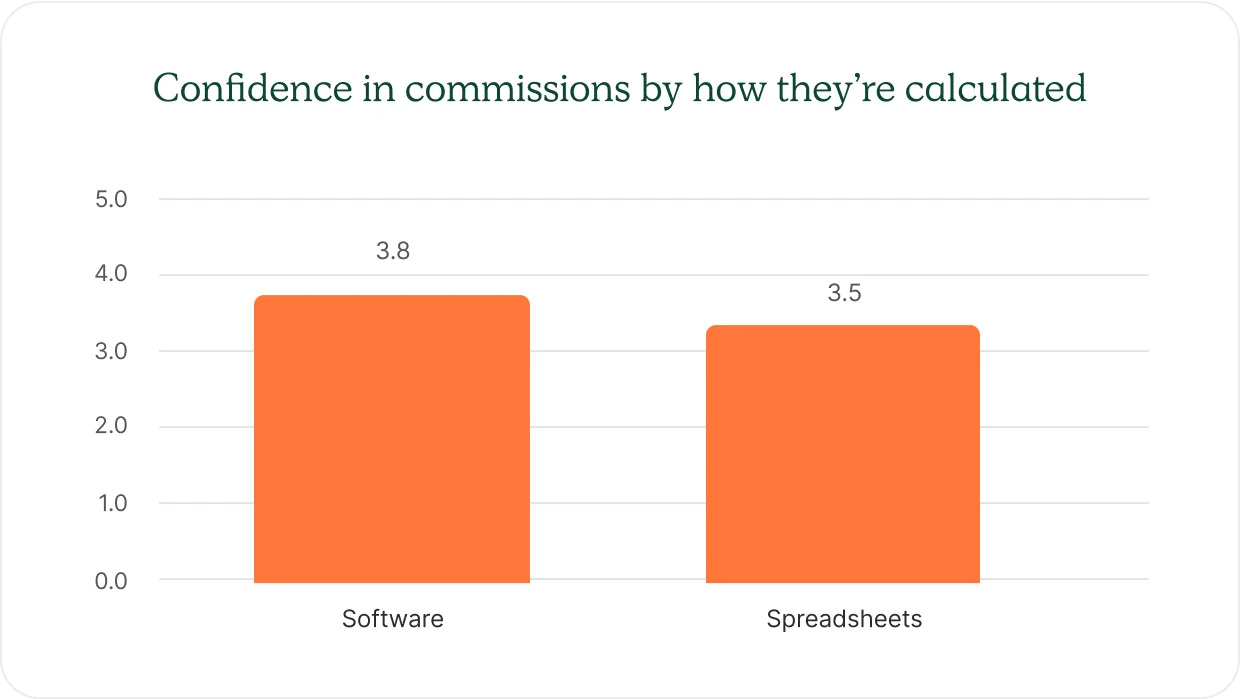
Reps who aren’t confident in their comp plans also don’t trust the accuracy of their commission check. Reps who trust their comp plans, trust their commission.

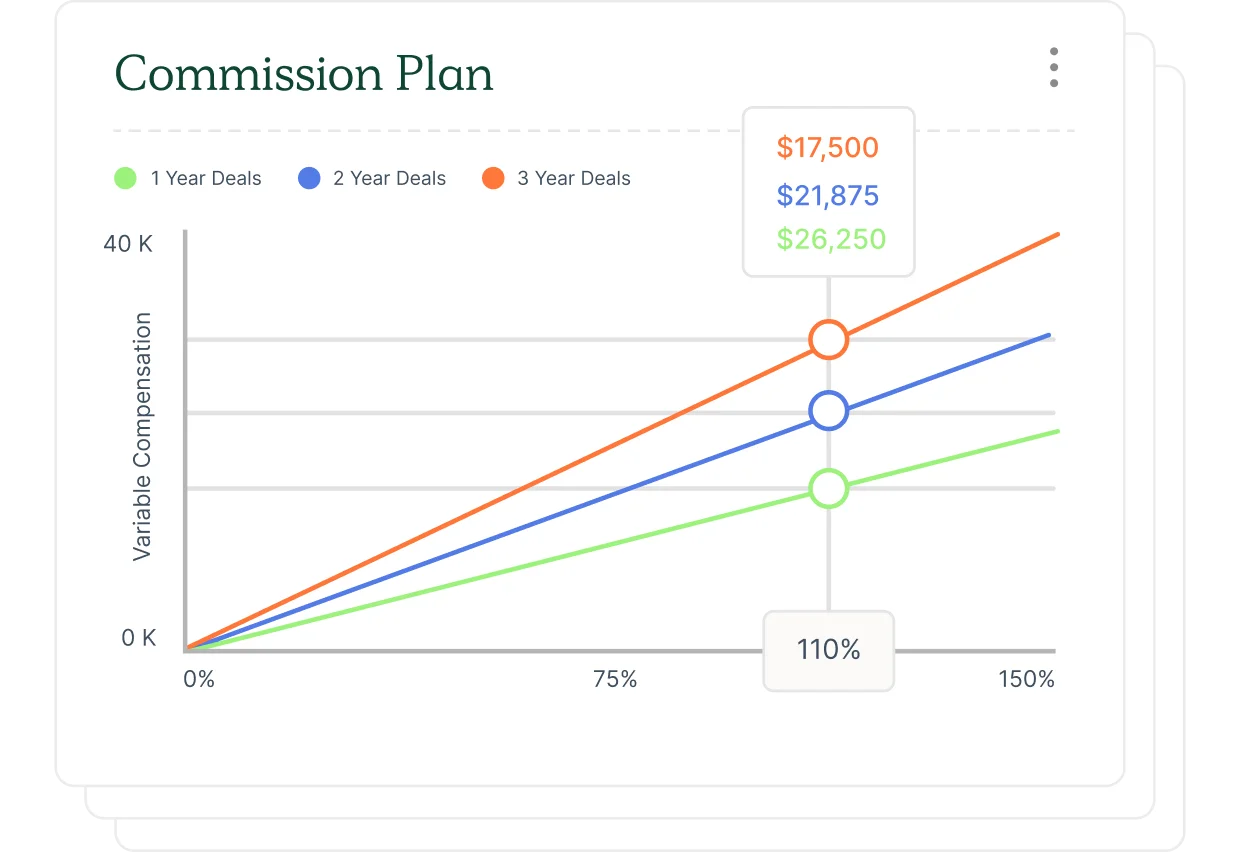
Show them their earnings potential (Compensation Hub’s Growth Curve is a great visual aid). A good interviewer will ask how many of your reps actually hit their on-target earnings (OTE), so be prepared to speak to that percentage.
To ensure your base salaries and variable pay packages compete with market standards, invite your People Team to the table. They play a critical role in securing solid sales talent and will bring market data to the conversation.
Market conditions could be better right now. Holding on to your top talent remains mission-critical. Don’t let your comp plan be the reason they leave.

Want this report accessible via PDF? Fill out the form to the right, and we’ll send one your way for easy sharing.
