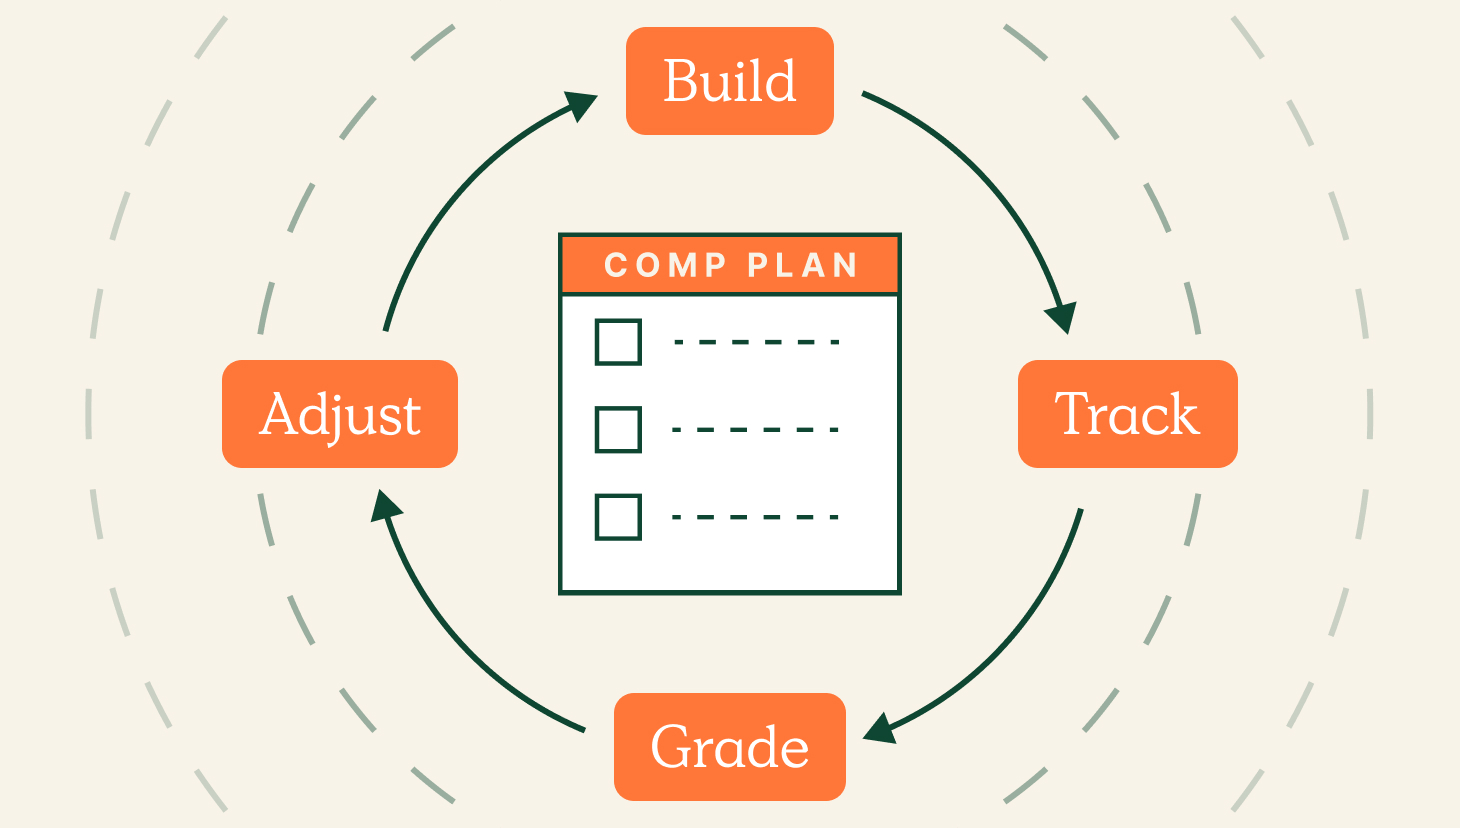
Sales compensation reporting refers to tracking and analyzing sales compensation data.
Companies might manually create their compensation dashboards, enlist the help of compensation reporting tools like QuotaPath, or conduct it manually in a spreadsheet. But the biggest thing to remember is that sales commission reports must comply with state laws and regulations regarding security, tax processes, and anti-discrimination legislation.
Below, we dive into how to create or write an effective compensation analysis, design a reporting system, tips for driving performance, and more.
What is sales compensation reporting?
Sales compensation reporting is the process of tracking, analyzing, and reporting on sales compensation data. This data can track sales performance, identify trends, and make informed decisions about sales compensation plans.
Design, track, and manage variable incentives with QuotaPath. Give your RevOps, finance, and sales teams transparency into sales compensation.
Talk to SalesWriting a sales compensation report
Ready to begin writing or revising your sales compensation reports? Start here.
The tables below show who should be involved, what data should be included, and then steps to execute it.
Remember, the data in your report will depend entirely on your compensation plan. But the most common elements are:
- Deal name
- Rep name (owner)
- Close date
- Amount
- Payment date (if applicable)
- Deal type (if applicable)
- Contract length (if applicable)
- Payment terms (if applicable)
- Products sold (if applicable
| Sales performance reporting | Including sales volume, revenue generated, expenses incurred, and other metrics that measure sales performance |
| Compensation data | Salaries, commission rates, bonuses, quotas, rates, and other forms of compensation that your reps earn |
| Employee data | Names, job titles, tenure, and other demographic information |
| Company data | Sales targets, compensation philosophy, and policies that impact sales compensation, such as commission clawbacks, commission reconciliation, or draws |
This report should include a collaborative effort from people across your organization. We recommend ensuring the following have a seat at the table:
| Sales leadership | VPs, directors, and managers are closest to the sales team and should have an excellent grasp of the compensation structures |
| RevOps | Your RevOps team, if applicable at your company, will have the greatest insights into how well (or not well) the compensation plan is performing based on revenue, time-to-close, and rep performance |
| Finance | Finance can provide valuable insights into the company’s financial performance and the impact of sales compensation on the company’s bottom line |
| Reps | Gather rep feedback to include in your reporting so that you can ensure your analyses tell a meaningful story that motivates reps |
| Human Resources or People | HR professionals are experts in compensation law and best practices |
Once you have data and your reporting council set, it’s time to write the report. Follow these steps.
Step 1: Identify the purpose of the report.
What do you want to achieve by writing this report? Do you want to track sales performance, identify trends, or make informed decisions about sales compensation plans? Setting clear goals ahead of time will help you determine what data to include and how to present it.
Step 2: Gather your data.
This will depend on the purpose of the report. For example, you will need data on sales volume, revenue generated, and commission expenses incurred to track sales performance.
Step 3: Clean and analyze the data.
Check for sales compensation accuracy and completeness, and identify trends or patterns at the rep, team, territory, and/or product level. Look for holes. What data are you missing to tell the full story?
Step 4: Write the report.
The report should be clear, concise, and easy to understand using data visualization and copy to add insights and clarity. It should also be tailored to the audience who will read it.
Step 5: Distribute/present the report to explain the data.
Distribute to the appropriate stakeholders and set a time to guide your audience through the numbers. If you don’t want to hold a dedicated meeting, you could record a video that allows you to speak over your digital report.
As for how long to spend writing will depend on your company’s size and complexity, the report’s purpose, and the data needed. Take your time and avoid shortcuts. A well-crafted report should be accurate, informative, and easy to read.
Designing a successful sales compensation reporting system
Whether you go the manual route of piecing together sales compensation insights or implementing a reporting system, ensure the reporting framework is consistent and visible.
Other best practices:
- The system should be accurate and reliable with real-time or up-to-date data
- Your reporting system should be user-friendly for all stakeholders and easily accessible
- Distribute reports timely and when your stakeholders expect it. Set up weekly, bi-weekly, monthly, or quarterly cadences to run and present reports.
- Choose a system that is flexible enough to meet the changing needs of the business
- Use a secure system that protects the data from unauthorized access
Challenges and pitfalls
Report processes often include challenges and pitfalls. The biggest challenges with sales compensation reporting are maintaining the analyses to ensure data accuracy and timeliness, creating reports people can understand, and drawing actionable insights from them.
Let’s look into each issue below.
Gathering accurate data: Sales compensation data can be complex and difficult because it often comes from various sources, such as sales contracts, CRM systems, and payroll records. The more you integrate the systems, the easier it is to keep track of and maintain accuracy.
Creating clear and concise reports: Sales compensation reports can be lengthy and complex. Create clear, concise, and easy to understand by tailoring the reports to the needs of the stakeholders who will be using them. Remember, the report fit for reps will likely look different than a report for a Finance audience. Lastly, make sure that you explain the value of the data.
Making informed decisions: These reports can provide a wealth of information about sales performance and compensation. However, using this information to make informed decisions about sales compensation is important. This may involve adjusting the sales compensation plan or identifying areas where sales performance can be improved.
Staying compliant with regulations: Sales compensation plans must comply with various regulations, including the Fair Labor Standards Act (FLSA) and the Equal Pay Act (EPA). Staying current on these regulations and ensuring compliance with sales compensation plans is important.
By understanding the challenges of sales compensation reporting, companies can take steps to overcome them and create a successful sales compensation reporting system.
| Automate the process | Save time and improve accuracy using a sales compensation management platform like QuotaPath |
| Use a centralized data repository | Got a RevOps team? This is a great project for them to stand up to make gathering and analyzing data easier. |
| Add reporting tools | Data visualization will make it easier to digest the data. Use a tool or commission reporting software that is easy to use and breaks up data into views that your stakeholders will understand. |
| Collect input | Ensure the reports meet your organization’s needs by gathering feedback from reps, leadership, the board, etc. |
| Review the reports | Evaluate and review reports to identify areas that need improvement |
| Stay up-to-date on regulations | Make sure your sales compensation plans remain compliant by staying abreast of compliance requests |
How to drive performance with reporting
Once your reports are finalized, you can leverage them to drive performance and revenue.
We recommend using reports to:
- Prioritize coaching efforts
- Identify gaps in the sales process
- Find reps’ strengths to replicate across the team
- Track and adjust low-performing sales tactics
- Measure the success of SPIFs, multi-year accelerators, and other compensation components
- Give your reps sales compensation visibility and how they’re performing to goal
- Increase competition using team leaderboards
- Gamify performance to increase morale
- Get a pulse on sales pipeline health
- Translate pipeline opportunities to potential earnings to motivate reps
The power of data visualization
We mentioned data visualization a couple of times so far.
Data visualization is the process of transforming data into visual representations that help to communicate insights and information. It can be a powerful tool for sales compensation reporting, as it can help to make complex data more understandable and easier to analyze.
Data visualization drives memory
People retain 65% of the information three days after watching an image with data compared to 10% of the information they hear. MIT also found that 90% of information transmitted to our brain is visual. (Source)
There are many different ways to use data visualization for sales compensation reporting. Here are a few examples:
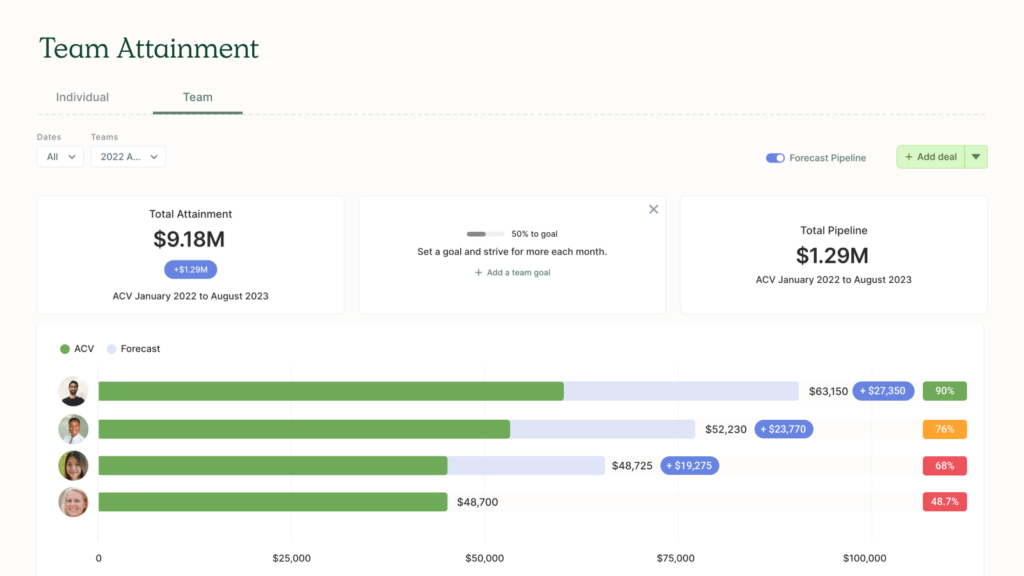
- Create charts and graphs: Charts and graphs are a great way to visualize data and track trends. They can show sales performance, compensation, and other metrics. Team leaderboards to ignite competition are especially useful.
- Use color coding: Color coding can make data more visually appealing and easier to distinguish. It can be used to highlight different data points or to group related data together.
- Designate icons: Icons can represent different data points or metrics. They can be used to make data more visually appealing and easier to understand.
- Add text labels: Text labels can provide additional information about the data. They can be used to explain what the data is showing or to provide context for the data.
Sales managers and RevOps leaders can use data visualization to create more informative and easier-to-understand reports. This can help them to make better decisions about sales compensation and to drive sales performance.
Aligning sales compensation reporting with business goals
To get the best outcomes possible (revenue and reps hitting the targets) from your sales compensation plans, you should tie your plans and sales performance metrics directly to your business goals.
You can start by collaborating with your leadership team to decide on the key business metrics for the quarter or year.
“Then ask, can any of those priorities be reinforced with sales compensation design?” said Mark Roberge, Managing Director at Stage 2 Capital.
These include customer acquisition costs (CAC), gross revenue retention (GRR), net revenue retention (NRR), customer lifetime value (LTV), and sales cycle length and velocity.
For examples of how to tie this to your comp plan reporting, see a few in the table below.
| Metric | Definition | Aligned to compensation |
| CAC | Customer acquisition cost (CAC) is the total cost of acquiring a new customer. It is calculated by dividing the total sales and marketing expenses by the number of new customers acquired. | Offer referral programs that reward employees for referring customers |
| GRR | Gross revenue retention (GRR) is a metric that measures the percentage of revenue from existing customers retained in a given period. It is calculated by dividing the total revenue from existing customers in the current period by the total revenue from existing customers in the previous period. | Give your customer-facing teams a SPIF or bonus for signing early renewals |
| NRR | Net revenue retention (NRR) is a metric that measures the percentage of revenue from existing customers retained in a given period after taking churn into account. It is calculated by dividing the total revenue from existing customers in the current period by the total revenue from existing customers in the previous period minus the amount of revenue lost due to churn. | Create expansion revenue incentives (SPIFs, bonuses, commissions) |
| LTV | Customer lifetime value (CLV) measures the total revenue a customer is expected to generate for a business over their lifetime. It is calculated by taking the average customer purchase amount and multiplying it by the average customer lifespan. | Encourage LTV by offering accelerators, or tiered commission structures, that reward higher earnings for |
FAQs
Are there any compliance and legal considerations in sales compensation reporting?
Some states, such as California and New York, require employers to issue sales compensation policies (or commission agreements) that any employee paid under variable pay structures must sign. These laws also require the employer to sign off and are part of a greater effort to provide pay transparency to give workers more leverage to negotiate their earnings and close gaps in wages.
QuotaPath hosts this process in-app, via Plan Verification, to distribute new policies or updates and collect and track signatures.
About QuotaPath
QuotaPath automates commission tracking and streamlines sales compensation management to help revenue leaders run payouts more accurately and efficiently.Schedule time with our team today to drive revenue and earnings transparency, orstart a free trial.