What Is A Sales Performance Report?
A sales performance report is a structured summary of key sales data that measures how well a sales team, individual rep, product, or territory is performing over a specific period of time.
It typically includes metrics like revenue generated, quota attainment, win rates, average deal size, and sales activity. These reports help leaders evaluate team productivity, identify trends or bottlenecks, and make informed decisions about forecasting, resource allocation, and sales strategy.
At its core, a sales performance report turns raw sales data into actionable insights.
Real-time data helps leaders make informed, timely decisions and course corrections. Tools like QuotaPath, which offers real-time reporting features, provide leaders with easy access to the data they need to take appropriate action.
These reports commonly include data such as sales revenue, the number of deals closed, quotas vs. attainment, sales by region, and multi-contributor sales.

Design, track, and manage variable incentives with QuotaPath. Give your RevOps, finance, and sales teams transparency into sales compensation.
Talk to SalesTypes of Sales Reports
In addition to the many benefits offered, there’s also a variety of sales performance reporting to draw insights from based on what you’re hoping to measure and drive.
| Quota and Attainment Reports | These reports help track how individual reps or teams perform relative to their sales quotas. QuotaPath’s attainment reports are especially useful for understanding which reps meet expectations and which might need additional coaching. These reports also help identify patterns of high and low performers, allowing leaders to make data-driven adjustments to their approach. |
| Compensation Performance Reports | These reports connect performance with pay. Compensation performance reports allow sales leaders to assess the effectiveness of current compensation plans. Are high-performing reps adequately incentivized? Are the right behaviors being rewarded? QuotaPath’s compensation reports can highlight if there’s alignment between top earners and top closers, ensuring that the compensation strategy is driving the desired results. |
| Pipeline Performance Reports | A detailed analysis of your sales pipeline’s health shows where deals are stalling and which stages have the highest drop-offs. These reports help sales leaders focus their team’s attention on the right deals to push forward and prevent bottlenecks from slowing revenue growth. |
| Revenue Performance Reports | These reports give a snapshot of the revenue generated by individual reps or teams over a specific period. By integrating revenue reports with compensation and attainment data, QuotaPath offers a clear view of how sales efforts translate into tangible results. |
| Split Deal Reports | These reports track deals that involve multiple contributors—common in modern sales teams where collaboration across departments or teams is necessary. QuotaPath’s platform allows users to track commissions and earnings across all contributors in split deals, ensuring equitable compensation and recognition for all involved. |
Try the most collaborative solution to manage, track and payout variable compensation. Calculate commissions and pay your team accurately, and on time.
Start TrialSales Performance Report for Forecasting and Planning
To drive smarter sales strategies and more accurate planning, here are five essential sales performance reports and how each serves a different purpose:
Sales Forecast Report
Predicts future revenue based on deal stage, historical conversion rates, and rep performance. It helps leadership understand whether targets are within reach and if adjustments are needed.
Sales Pipeline Report
Breaks down current opportunities by stage, deal size, and expected close date. It’s a snapshot of what’s in play—ideal for assessing deal health and identifying bottlenecks.
Sales Trend Report
Analyzes performance over time, surfacing patterns like seasonality or month-over-month growth. Use this to inform quota setting and hiring plans based on historical momentum.
Win/Loss Analysis Report
Compares closed-won vs. closed-lost deals, revealing what’s driving success or contributing to drop-off. It’s critical for refining messaging, targeting, and objection handling.
Sales Activity Report
Tracks rep-level actions—calls, emails, meetings—to correlate effort with outcomes. Helps managers identify top performers, coach underperformers, and improve team efficiency.
Key Components of a Sales Performance Report
After choosing which kinds of sales reports best address your needs, it’s time to create your report. What should a written sales summary report look like? Every effective sales analysis report should include the following fundamental components.
- Key Metrics: Depending on the report’s purpose, key metrics typically include measurements such as quota attainment, win/loss ratios, sales velocity, and average deal size.
- Visualization: Tools like graphs, bar charts, and performance dashboards help translate numbers into actionable, at-a-glance insights, making data easier to understand and digest.
- Customizable Filters: Drill down into data to view details for specific periods, teams, reps, territories, products, and deal types, tailoring the report based on the purpose and audience.
- Comparative Data: This is used to compare current performance to past periods, such as year-over-year, quarter-over-quarter, or month-over-month, and identify trends. It is useful for decisions like coaching and compensation planning or optimization.
- Integration Point: Pull in data from multiple sources for up-to-date information that creates a more complete picture. For instance, QuotaPath integrates seamlessly with HubSpot to build reports using CRM and compensation data easily.
Sales Report Example
Here are two sales reports examples using earnings and attainment values, along with descriptions of what they tell about sales performance.
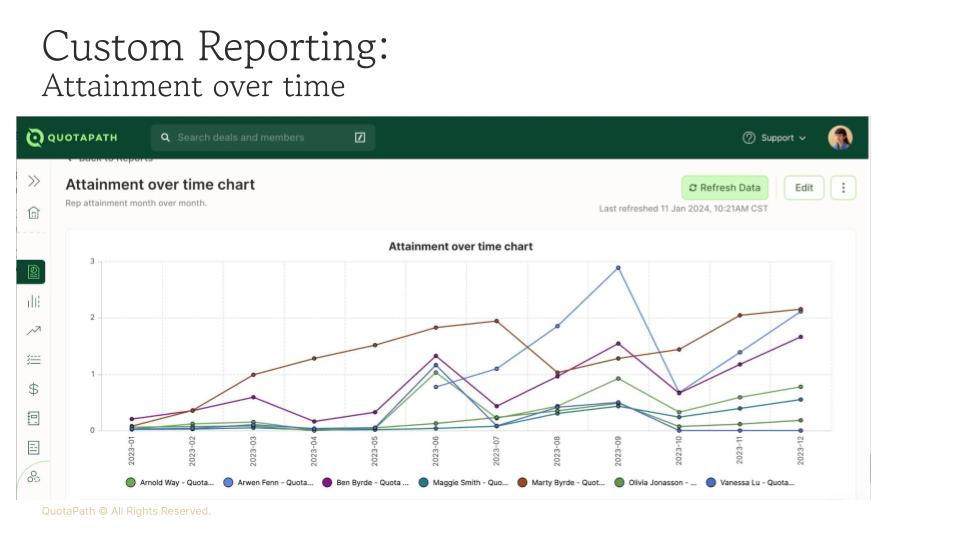
Our Attainment Over Time report highlights which sellers maintain the most consistent performance over a specified period.
For example, in a year-long quota, leaders can track the team’s performance trends across the year, identifying steadiness from month to month.
In the example shown, Marty (indicated by the brown line) consistently reaches 100% of quota, while the rep represented in blue peaks at 250% before dropping to 50% of the target in the following month.
This type of report is ideal for leaders looking to pinpoint seasonal patterns, as it visualizes these trends clearly.
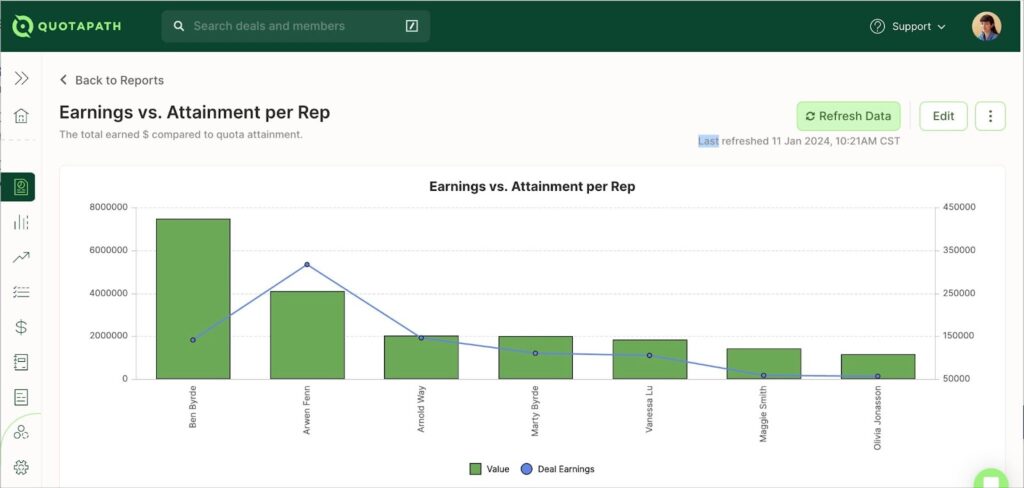
The Earnings vs. Attainment report provides insights into who is generating the most sales and earning the highest commissions, while also revealing any imbalances, such as someone earning significantly more despite lower sales.
On its own, this data might not stand out. But in comparison, you can see that although Ben sells nearly double what Arwen does, Arwen actually earns more in commission.
Why could that be?
This might suggest that Ben frequently sells a product with a lower commission rate, or that Arwen reached her accelerators in Q1 and now benefits from a higher commission rate on each sale for the remainder of the year.
Sales Commission Reports in QuotaPath
See what other sales performance reports and commission analyses QuotaPath offers.
Read BlogSteps to Build an Effective Sales Performance Report
A well-structured sales performance report helps leadership make faster, more informed decisions. Here’s a step-by-step approach to building one that drives insight and action.
Step 1: Define the Purpose of Your Sales Report
Start by identifying the question your report is answering. Are you forecasting revenue? Coaching reps? Understanding why deals are lost? The goal should guide what data you include—and exclude.
Step 2: Identify Key Sales Metrics to Track
When it’s time to build out your reports, consider leveraging the following sales metrics.
| Quota Attainment | The percentage of sales quota achieved by reps or teams within a specific time frame. This is one of the most basic yet critical metrics in any sales performance report, providing a quick snapshot of how individuals and teams are performing against their goals. |
| Revenue Growth | Tracking total revenue over time, this metric helps leaders understand how well the company is converting leads into sales. It’s a key measure of overall business health. |
| Lead-to-Close Ratio | This metric indicates the percentage of leads that convert into closed deals. A low lead-to-close ratio could signal a need for better lead qualifications or sales training, while a high ratio might indicate that your team is hitting the mark in closing qualified deals. |
| Sales Velocity | How quickly deals move through the sales pipeline. A slow sales velocity might indicate bottlenecks in the process, while a faster velocity typically correlates with higher revenue generation. |
| Compensation-to-Revenue Ratio | This ratio tracks the cost of sales (compensation) relative to the revenue generated. Monitoring this ensures that your compensation plan remains sustainable while motivating reps to achieve their goals. |
Step 3: Organize and Segment Your Sales Data
Group your data by team, individual rep, time period, deal stage, or region—whatever best aligns with your goals. Segmentation lets you spot patterns, outliers, and performance gaps more easily.
Step 4: Make the Sales Report Visual and Actionable
Use tables, charts, and filters to highlight insights at a glance. Include clear next steps, KPIs, and owner assignments so that your report doesn’t just inform—it drives action.
Try the most collaborative solution to manage, track and payout variable compensation. Calculate commissions and pay your team accurately, and on time.
Start TrialHow QuotaPath Simplifies Sales Reports
QuotaPath takes the complexity out of building and managing sales performance reports. By syncing directly with your CRM and commission data, QuotaPath automatically pulls in the right metrics—like attainment, earnings, and quota progress—so you can skip the spreadsheets and manual updates.
With built-in dashboards, flexible filters, and exportable views, teams can segment performance by role, rep, or time period in just a few clicks. Whether you’re forecasting, reviewing rep productivity, or analyzing plan effectiveness, QuotaPath gives you the clarity and accuracy to act quickly and confidently.
If you’re looking to improve transparency, save time, and align performance tracking with your comp plans, QuotaPath makes it easy. Book a demo today to learn more.