How do you understand the true impact of your sales commission strategy? Do you know what deals you’ve paid the largest percentage of commissions on and why? (Spoiler: It’s not always your biggest deals that yield the highest effective rates.)
What about your growth team’s consistency over time? How are you measuring that?
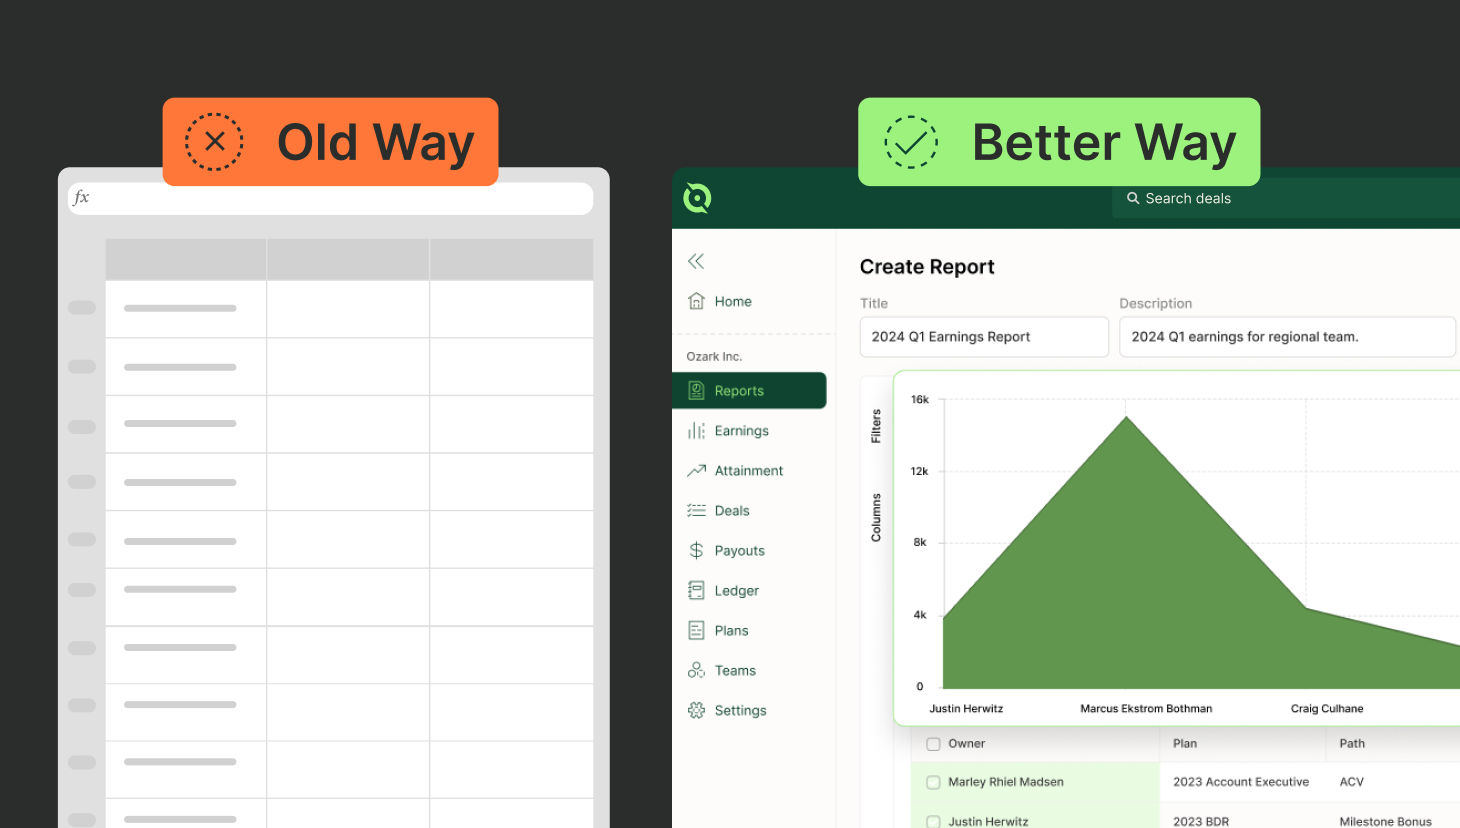
At the beginning of 2024, QuotaPath released new compensation reporting to measure the business value and performance of the GTM team’s compensation plans and performance.
Our new reports pull your deals and earnings data, transforming it into easy-to-understand visuals. This empowers you to optimize your sales strategy and drive performance like never before.
Here’s what you can achieve:
- Spot hidden trends: Analyze changes in attainment over time and identify seasonal fluctuations impacting your quota.
- Benchmark performance: Compare earnings across various periods, teams, and commission plans.
- Identify performance gaps: Discover the distribution of attainment levels and see if you have a healthy mix of performers.
- Optimize product strategy: Understand which products are easier or harder to sell and how they impact attainment, allowing for targeted adjustments.
- Maximize profitability: Uncover if high-performing products are the most profitable for your organization and reps.
- Reward top performers: See if your high-achievers consistently close larger deals, helping you develop effective reward structures.
While the number of reports you can create is nearly limitless based on your inputs and filters, here are a few of our favorites:
- Total earnings by rep
- Quota attainment by rep
- Deal earnings by plan
- Earnings by rep by path
- CAC layer cake
In this blog, we’ll delve into four key reports:
- Deal Earnings vs. Deal Value: Identify outlier deals with higher-than-expected payouts and analyze the reasons behind them.
- Attainment Over Time: Track seller consistency and pinpoint any fluctuations in performance.
- Earnings vs. Attainment: See who’s consistently hitting targets and earning the most commissions.
- Top Commission Rates Per Deal: Gain transparency into the effective commission rate when multiple commissions are paid on a single deal.
By leveraging these reports, you can gain a deeper understanding of your sales compensation plan’s effectiveness, identify areas for improvement, and ultimately optimize your sales team’s performance and profitability.
Design, track, and manage variable incentives with QuotaPath. Give your RevOps, finance, and sales teams transparency into sales compensation.
Talk to SalesReports in QuotaPath
Now that we’ve explored the core functionalities of our custom compensation reports let’s delve a little deeper. Here, we’ll showcase advanced reports designed to unearth valuable insights you might miss.
Deal Earnings vs. Deal Value
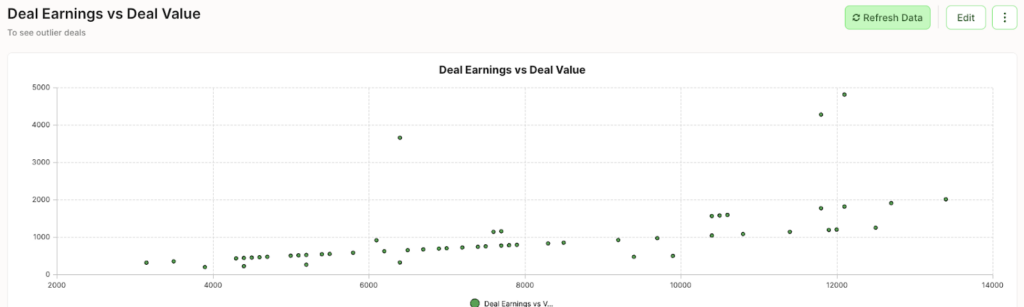
This report allows you to easily signal deals with extreme payouts so that you can research them to see why the payouts were so high.
Ideally, all deals would appear as dots in a line. But that’s hardly the case, especially when you factor in accelerators and milestone bonuses.
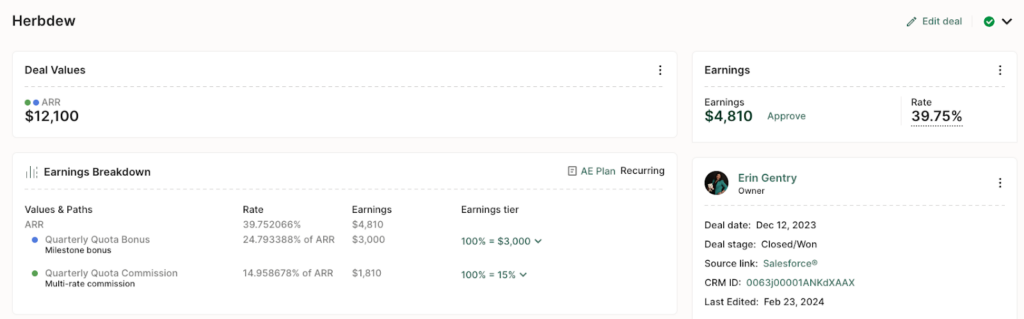
In the example above, you can see three outlier deals that yielded a much higher payout, at nearly 4x the amount of the other deals. By clicking on the deal and opening a new tab, we can look behind the deal (in this case, Herbdew) and see that the rep hit their quarterly quota bonus milestone. As a result, the rep earned an additional $3,000 to the deal payout.
Attainment Over Time
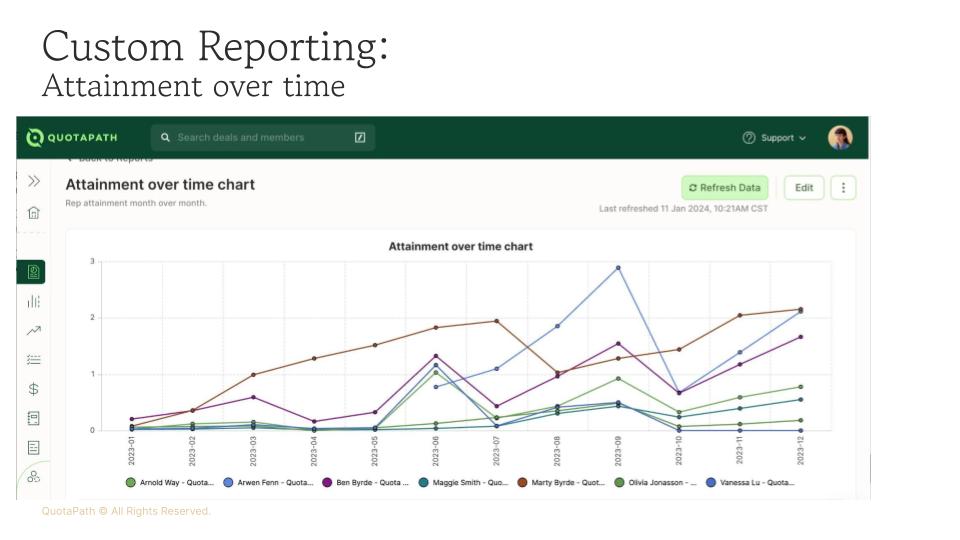
Our Attainment Over Time report shows which seller is most consistent across a set amount of time.
So, for a year-long quota, leaders can examine the team’s trend over the year and identify its consistency across periods.
In the example above, you can see that Marty (the brown line) is consistently at 100% quota versus the rep in blue, who spiked at 250% above quota, only to fall to 50% of the goal the next month.
For leaders interested in identifying seasonal trends, a report like this visualizes it clearly.
Try the most collaborative solution to manage, track and payout variable compensation. Calculate commissions and pay your team accurately, and on time.
Start TrialEarnings vs. Attainment
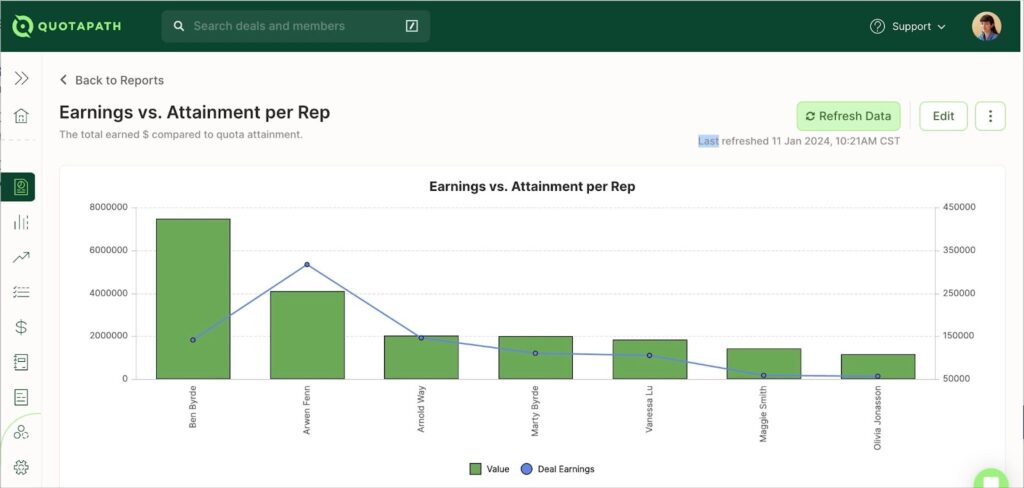
This report helps you identify who is selling and earning the most. It can also flag issues where someone might be making a lot of money but selling less.
Now, in a vacuum, this isn’t super interesting. However, comparing people, you can see above that Ben sells almost twice as much as Arwen, yet Arwen earns more commission.
Why is that?
This could indicate that Ben consistently sells a product with a lower commission rate or that Arwen hit her accelerators in Q1 and now earns an accelerated rate on every deal the rest of the year.
Top Commission Rates Per Deal
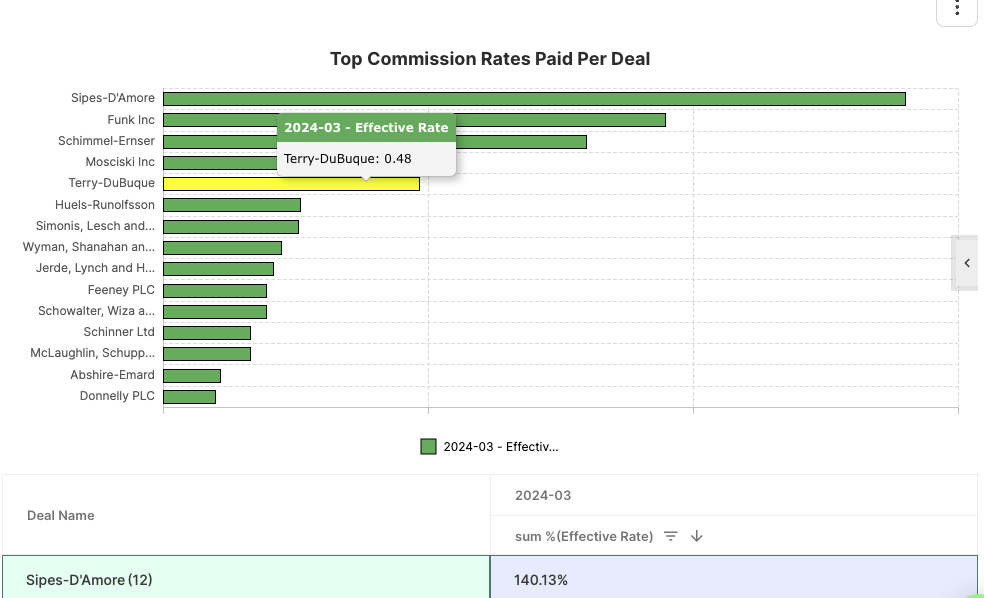
Our fourth report reflects the top commission rates per deal.
This enables you to answer how much commissions you pay across multiple people who touch a deal, like a marketing person, account executive, sales engineer, sales manager, and director.
We recommend that your collective rate sits at 25% or below, but your hidden commission cost could exceed 35% if you’re not attentive.
Design, track, and manage variable incentives with QuotaPath. Give your RevOps, finance, and sales teams transparency into sales compensation.
Talk to SalesConclusion
By leveraging QuotaPath’s sales commission reports, you can move beyond guesswork and gain a data-driven understanding of your sales compensation strategy. These insights empower you to identify top performers, optimize commission structures, and drive long-term sales growth.
To learn more about QuotaPath, schedule time with our team today.