Did you know payroll typically accounts for 15-30% of revenue in most industries? But how do you know if you’re overspending?
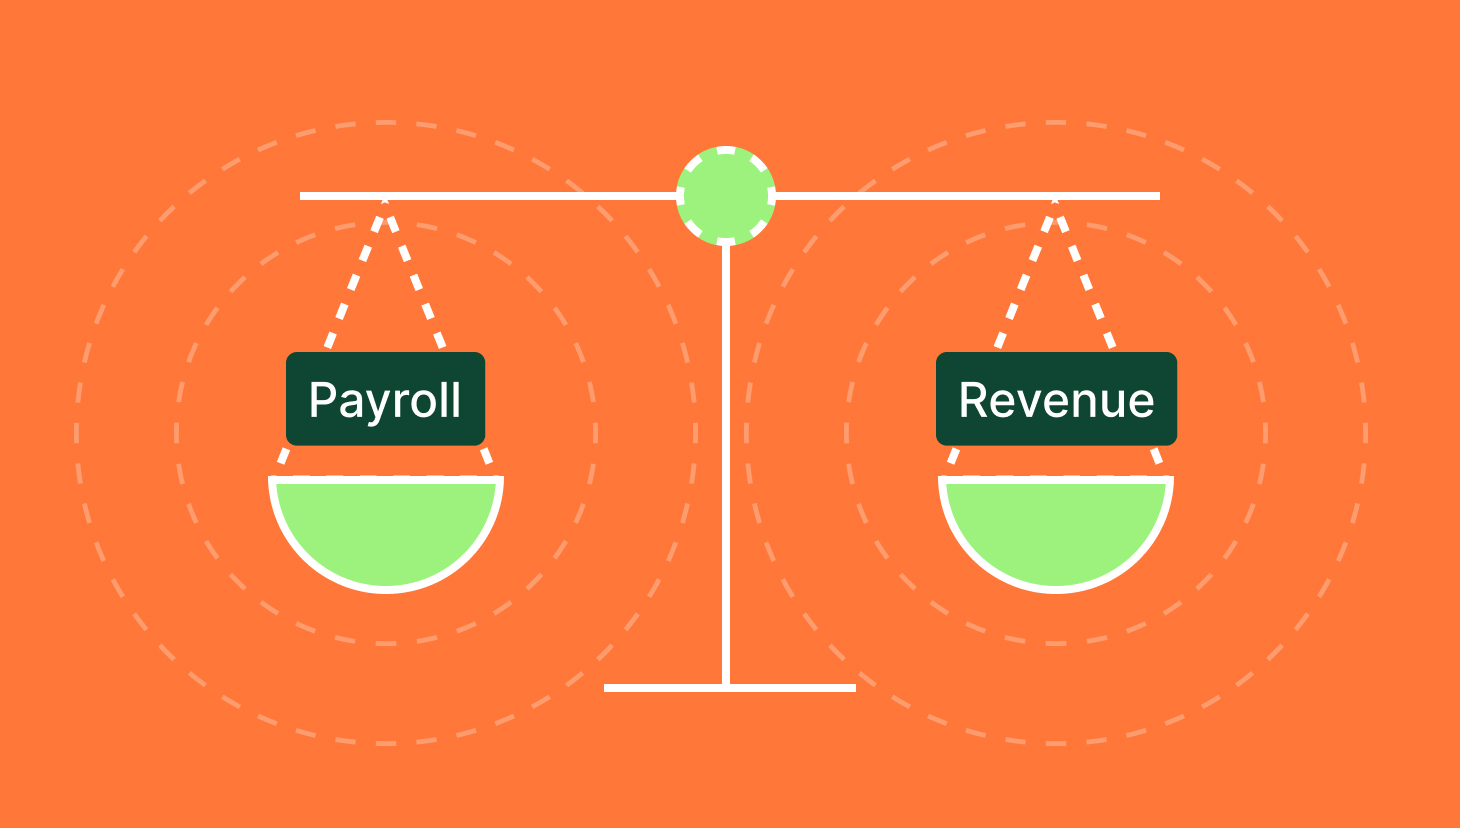
The payroll to revenue ratio measures the proportion of a company’s revenue spent on employee compensation, including salaries, wages, benefits, and payroll taxes. This ratio is a key indicator of how efficiently a business manages its labor costs relative to the income it generates.
In financial management, the payroll to revenue ratio plays a critical role in evaluating operational efficiency, maintaining profitability, and guiding strategic decisions related to hiring and scaling. A well-balanced ratio helps ensure that payroll expenses are sustainable and aligned with the company’s revenue performance.
Moreover, most CFOs consider their organization’s compensation and payroll structures “ineffective.”
Plus, businesses in Sales, RevOps, Finance, and now HR can leverage this metric for decision-making around labor cost efficiency, business scalability and profitability, industry competitiveness, hiring and compensation strategy, and more.
Why are we writing about this? Because QuotaPath’s role in helping businesses manage commissions and payroll efficiency includes commission projections, gauging revenue and team efficiency, and maintaining teams aligned on revenue expectations.
In this blog:
- Understand the Payroll to Revenue Ratio: Learn how this financial metric helps businesses measure labor cost efficiency, predict profitability, and align workforce expenses with revenue goals.
- See Industry Benchmarks & Trends: Explore payroll-to-revenue ratio benchmarks across industries, from SaaS and tech (20-30%) to healthcare (40-50%) and retail (8-15%), and understand what these numbers mean for your business.
- Learn How to Optimize Payroll Costs: Discover strategies to improve payroll efficiency, from automating commission tracking to aligning compensation with revenue growth for better financial decision-making.
- Understand QuotaPath’s Role in Financial Planning: See how QuotaPath helps businesses anticipate commission expenses, track sales performance, and improve cash flow management in real-time.
What is a Payroll to Revenue Ratio?
First, let’s define what it actually is. The payroll to revenue ratio is a financial metric that shows what percentage of a company’s revenue is spent on payroll. In other words, it helps you understand how much of every dollar earned is allocated to employee compensation, including salaries, wages, benefits, and payroll taxes. It’s a straightforward way to gauge how efficiently labor costs are being managed in relation to company income.
Formula:
Payroll to Revenue Ratio = (Total Payroll Expenses / Total Revenue) × 100
For example, if a company’s payroll is $1,000,000 and its revenue is $5,000,000, the ratio would be 20%. This ratio matters because it helps gauge labor cost efficiency and profitability impact. It’s a key metric that enables HR, Sales, and Finance teams to align workforce expenses with revenue growth, ensuring headcount investments are sustainable and strategically sound.
Calculating Your Payroll to Revenue Ratio
Before optimizing payroll spending, you must understand where you stand. Calculating your payroll to revenue ratio is the first step in assessing labor cost efficiency and financial performance.
Step-by-step guide to calculation:
- Identify total payroll expenses: Salaries, benefits, bonuses, commissions, taxes.
- Determine total revenue: Sales, services, recurring revenue.
- Apply the formula: Use the equation to calculate the ratio.
- Compare over time: Monthly, quarterly, or annually to track trends.
Payroll Costs vs. Revenue Comparison
| Company A | Company B | Company C |
| Payroll: $500,000 | Payroll: $750,000 | Payroll: $1,000,000 |
| Revenue: $2,000,000 | Revenue: $3,000,000 | Revenue: $5,000,000 |
| Ratio: 25% | Ratio: 25% | Ratio: 20% |
Design, track, and manage variable incentives with QuotaPath. Give your RevOps, finance, and sales teams transparency into sales compensation.
Talk to SalesBenefits of Calculating Your Payroll to Revenue Ratio
According to the U.S. Bureau of Labor Statistics, labor is one of the largest business expenses, accounting for up to 70% of total operating costs in some industries. What percentage of expenses should payroll be?
Once you’ve calculated your payroll expense to revenue ratio, interpreting the result is just as important. Understanding this ratio can unlock valuable insights that drive better financial planning and business growth.
Labor Cost Efficiency: Helps businesses control expenses and improve profitability.
Workforce Optimization: Ensures HR teams effectively structure salaries, bonuses, and commissions.
Strategic Decision-Making: Aligns workforce costs with revenue goals and business scaling.
Predicting Profitability: Helps forecast hiring costs and future payroll budgeting.
Average Payroll to Revenue Ratios By Industry
Payroll structures vary widely by industry, driven by differences in labor intensity, operational models, and cost structures. What’s considered a healthy payroll to revenue ratio in one sector might be unsustainable in another. The table below outlines payroll as a percentage of revenue by industry to help you compare and contextualize your own numbers.
| Industry | Payroll as a Percentage of Revenue | What to Expect |
| Retail | 8% – 15% | Retail businesses operate with tight margins and rely on high sales volume to stay profitable. Many manage costs by hiring part-time or seasonal workers. |
| Construction | ~20% | Labor is a significant expense, as skilled trades and compliance with safety regulations increase payroll costs. |
| Healthcare | ~41% | A labor-intensive industry that relies on specialized professionals such as doctors and nurses, leading to higher payroll expenses. |
| Hospitality | ~30% | Hotels and resorts must staff appropriately to maintain service quality while also balancing occupancy rates and seasonal demand. |
| Restaurants | ~28% | Restaurants face variable labor costs based on service type (fast food vs. fine dining), requiring efficient scheduling and payroll management. |
| Marketing | ~39% | Marketing and advertising agencies are service-driven, investing heavily in creative and strategic talent to drive business success. |
| Manufacturing | ~12% | Automation has reduced some labor costs, but skilled workers remain essential for operations, maintenance, and quality control. |
| SaaS / Tech | 20% – 30% | SaaS and tech companies have higher payroll expenses due to skilled labor, commissions, and competitive compensation for developers and sales teams. |
Source: Rippling
Statistical Insights
Understanding how the payroll to revenue ratio varies across industries provides important context for evaluating what’s considered a healthy or sustainable benchmark.
Tech and SaaS companies have higher payroll expenses due to commissions, bonuses, and the need to attract top talent in a competitive market. This drives their payroll to revenue ratios upward, reflecting the significant investment in human capital required to stay competitive and innovative.
Healthcare and service industries often have a higher ratio because a substantial portion of revenue is dedicated to payroll expenses, which can potentially reduce profitability. Conversely, a lower ratio indicates that the company is retaining a larger revenue share after accounting for labor costs, which can improve margins and support reinvestment in other business areas.
According to Rippling, retail businesses operate with tight margins and rely heavily on sales volume. As a result, these companies tend to maintain lower payroll to revenue ratios to preserve profitability and remain agile in highly competitive environments.
What to Include in Payroll Costs
To accurately calculate payroll to revenue ratio, it’s important to understand what goes into the “payroll” side of the equation. Here’s a breakdown of the most common payroll components that factor into this metric.
Breakdown of payroll expenses that impact the ratio:
- Salaries and Wages: Fixed salaries, hourly wages.
- Bonuses and Commissions: Sales incentives, performance bonuses.
- Payroll Taxes: Employer contributions to social security, Medicare.
- Benefits and Perks: Health insurance, retirement plans.
- Stock Options & Equity Compensation (for startups & tech companies).
How QuotaPath Helps with Optimizing Pay Spend
Unexpected financial events, such as the collapse of Silicon Valley Bank (SVB) in 2023, highlighted the importance of having real-time visibility into payroll and commission expenses for companies.
While traditional payroll systems provide insights into fixed salaries, they often lack clarity on variable compensation, like commissions.
That’s where QuotaPath plays a role.
In the wake of SVB’s shutdown, many businesses turned to QuotaPath’s earnings forecasts, deal reviews, and approval tools to assess upcoming commission expenses.
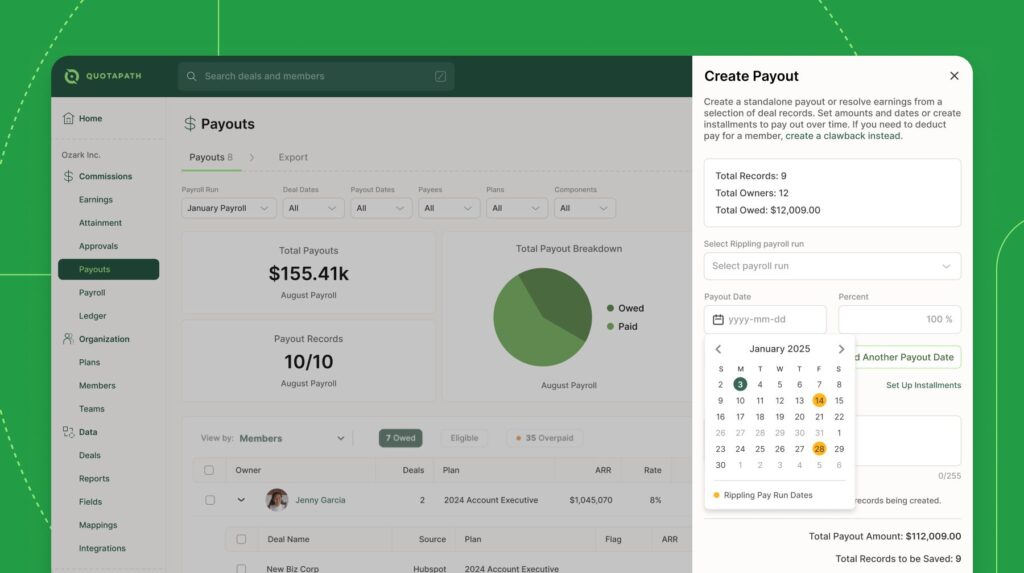
Instead of scrambling for spreadsheets or waiting on reports, they could log in and instantly see expected payouts. Here are three key ways QuotaPath helps businesses manage payroll, cash flow, and team efficiency, regardless of market shifts.
1. Get a Pulse on Expected Commission Expenses
- Understanding upcoming payroll expenses is critical for financial planning, especially in uncertain times.
- QuotaPath provides real-time commission tracking, helping teams:
- Prepare for end-of-month or quarterly payroll runs
- Forecast commission payouts when applying for loans, fundraising, or managing cash burn
Use Case: Finance and HR leaders can quickly assess how much cash is needed to cover payroll, including commissions.
2. Measure Your Capital & Team Efficiency
- QuotaPath tracks historical commission data, giving businesses deeper insights into cost-per-win and rep effectiveness.
- Teams can:
- Analyze effective commission rates
- Showcase revenue efficiency to investors
- Identify patterns in sales performance and compensation trends
Use Case: A startup preparing for a funding round can present commission expense trends to investors to demonstrate capital efficiency.
3. Improve Weekly Pipeline & Sales Reviews
- QuotaPath’s pipeline tracking tools help sales and finance teams stay aligned on revenue expectations.
- How it works:
- Use Team Attainment leaderboards to review active deals and projected commissions
- Reps can share won deals, forecasted earnings, and upcoming opportunities
- Leadership can evaluate sales momentum and compensation impact
Use Case: Sales teams can align forecasts with finance, ensuring accurate projections of cash flow and commissions.
Optimizing Your Payroll to Revenue Ratio
Keeping payroll and revenue balanced is critical as compensation is often a company’s largest ongoing expense. If payroll grows faster than revenue, it can quickly erode profitability, strain cash flow, and limit growth. A strong payroll to revenue ratio reflects labor cost efficiency and indicates that compensation strategy is aligned with financial performance.
Improving this ratio requires visibility into fixed and variable pay structures and real-time insights into how compensation impacts your bottom line. This is where QuotaPath makes a difference. QuotaPath helps businesses manage compensation, cash flow, and team efficiency to optimize the payroll-to-revenue ratio.
See how QuotaPath simplifies payroll to revenue ratio optimization. Schedule time with a team member today.