RevOps is evolving as it rises in popularity, creating trends in 2023 like sales role changes, increased AI tool use, greater customer-centricity, and different organizational structures. For instance, our team is starting to discuss RevOps shifting from one department to a more distributed team with an ops person in marketing, sales, and customer success.
These trends will likely influence which metrics RevOps teams will pay attention to this year, in an effort to inform strategic actions and ensure operational success.
While there are many metrics to keep track of, it is a best practice to select one north star metric (useful in commission management) that’s the most important one for the quarter for your organization. This is essential as it creates alignment across your organization, so everyone pulls together to attain one shared goal.
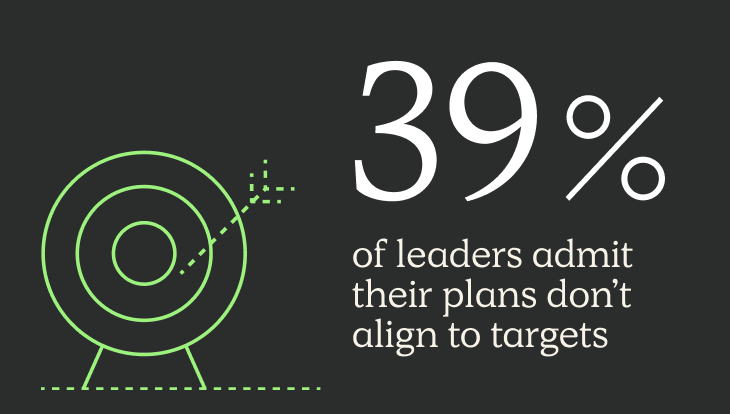
“Alignment” most needed area of improvement in sales compensation management
Our Compensation Trends study revealed that aligning your organization’s north star metric with your incentive packages is the part of your sales compensation process that needs the most work.
Read MoreWhat metrics are the most impactful for RevOps to track, and how do they translate these numbers into strategic actions? We sourced the top RevOps metrics to track with some guidance from three RevOps leaders.
What are Revenue Operations Metrics
Revenue operations (RevOps) metrics are key performance indicators (KPIs) that measure the efficiency and effectiveness of a company’s revenue-generating processes.
These metrics align sales, marketing, and customer success teams to track performance across the entire customer lifecycle.
Some common RevOps metrics include customer acquisition cost (CAC), customer lifetime value (CLV), lead conversion rates, sales cycle length, and net revenue retention (NRR). Organizations can identify bottlenecks, optimize processes, and ensure sustainable revenue growth by monitoring these metrics.
Why Measuring Revenue Operations is Important
RevOps metrics are important because they provide a unified view of performance across sales, marketing, and customer success, enabling better alignment and collaboration. They help organizations identify inefficiencies, track progress toward revenue goals, and make data-driven decisions to optimize processes. By focusing on these metrics, companies can improve forecasting, enhance customer experiences, and ensure sustainable revenue growth. Ultimately, RevOps metrics drive accountability and efficiency across the entire revenue engine.
Sales RevOps Metrics
Sales metrics help you measure the performance of your sales and revenue-generating teams. These metrics also help you gauge lead quality generated by marketing.
Top sales RevOps metrics to track include:
Revenue
The amount of new revenue generated is an essential RevOps metric. Revenue is the amount of proceeds generated from product or service sales. This measurement helps you assess profitability after deducting total expenses.
Forecasted revenue
Forecasted revenue is the estimated revenue prediction based on the average closing percentage of customers in the pipeline. This metric helps estimate future cash flow.
Customer acquisition cost
Customer acquisition cost (CAC) is the total cost to win a new customer. Tracking this measurement allows you to gauge profitability compared to lifetime customer value (LCV). It’s also useful for assessing the cost efficiencies of the customer acquisition process.
Sales pipeline velocity
Pipeline velocity measures how quickly opportunities move through the stages of a sales process. It can be calculated by taking the total value of closed deals for a specific period divided by the average sales cycle length. This metric helps gauge the performance of the sales team and identify parts of the sales process requiring improvement. Sales pipeline velocity can also help forecast future revenue.
One best practice for managing your metrics came as a suggestion from John Quarles, Co-Founder at Direct Ascent. John suggests looking at real-time funnel data.
“I like to compare actual results versus the operating plan for volume (opportunity creation), velocity (cycle time), and conversion to see how well we are at managing,” said John.
John continued, “I also like to focus on rep attainment, specifically the distribution of attainment, since that tells me how hard it is in the field for the typical seller. Lastly, I want a financial understanding of which GTM motions are most efficient so I can continue directing investment where it has the highest monetization.”
Conversion rate
Conversion rate is the percentage of leads that advance through the sales process to become paying customers. Tracking this metric gives you a picture of the entire sales funnel across all revenue functions to diagnose why leads aren’t converting or where the roadblocks are in the process.
One of the best RevOps metrics best practices from Nicholas Gollop, Founder/RevOps & GTM Strategy Advisor at RevOps On-Demand, suggests using 1-2 KPIs per funnel section.
“This gives me an overview of what’s important and guides the next drill down of KPIs to look into, such as activities, meetings booked, revenue per segment, and attainment,” Nicholas said. “I usually do this by designing a full-funnel conversion report in Excel to identify bottlenecks within the business. I once managed to debunk a theory that the SDRs were doing poor conversions. It was actually the lead quality that was bad, but everything the SDRs were sending through was good and with high chances of closing.”
Customer lifetime value
The customer lifetime value (CLV) is the total profit or revenue a customer spends on your products or services throughout their entire relationship with your business. This metric is important to track to ensure profitability by comparing it with CAC. It also helps you identify your best-fit customers and prospects, reduce customer churn, increase CLV over time, and optimize sales and marketing efforts.
Design, track, and manage variable incentives with QuotaPath. Give your RevOps, finance, and sales teams transparency into sales compensation.
Talk to SalesMarketing RevOps Metrics
Marketing metrics help you track campaign performance and provide insights into customer behavior. These measurements help you gauge the success of your marketing strategy to attract and convert qualified leads.
Some marketing RevOps metrics include:
Traffic
Traffic is the volume of website visits from various sources such as search engines, advertisements, third-party sites, email, and social media. This metric also reveals which pages of your site are visited most often and for the longest duration, as well as bounce rates. Tracking these figures collectively and individually allows you to identify which sources are most effective or require improvement.
Sessions
Unlike traffic, sessions capture user interactions with your website during a given visit and show you which pages they move through, for how long, and in what order, and terminate after 30 minutes of inactivity. Tracking this metric helps you gauge the success of your SEO to identify areas for improvement.
Clickthrough Rate
Clickthrough rate (CTR) is the number of clicks to your website or landing page from a specific ad or campaign. It is expressed as a percentage of the times the ad was displayed. For example, if an ad is displayed 100 times and you have 7 clicks, then the CTR would be 7%. Tracking this metric helps you measure the success of your ad copy, keyword selection, and graphics choice.
Session-to-Contact Rate
The session-to-contact rate is the percentage of website visitors that complete a form or take an action. Tracking this metric helps you gauge the effectiveness of your web copy and calls to action and the amount of visitor engagement.
Attributed revenue
Revenue attribution ties marketing activities to revenue to help determine which marketing efforts are most effective along the buyer’s journey. Tracking attributed revenue helps you see which marketing channels or initiatives drive the most sales. This enables you to make informed decisions about how to spend marketing dollars, decrease CAC, and boost profitability.
Customer RevOps Metrics
Customer retention is essential to the long-term growth of your business as acquiring new customers is less profitable than retaining and growing existing customers. So, it’s important to track how well you are serving and supporting existing customers to protect recurring revenue.
Some customer RevOps metrics you should track include:
Revenue Retention
Revenue retention shows you the percentage of recurring revenue from existing customers you are keeping. Tracking this metric helps you determine things like if you are targeting the right customers and how effective your new customer onboarding, service, and support are.
Customer Churn Rate
Customer churn rate is the percentage of customers that cancel or stop paying for your product or service during a specific period. The lower your customer churn rate, the easier it is for you to hit your growth targets, and the more profitable your business will be.
Although churn rates vary by industry, 5.6% is an average benchmark across businesses, according to Recurly Research. Tracking this metric helps you gauge the overall effectiveness of your customer service and support functions.
Renewals, upgrades, and cross-sells
Renewals, upgrades, and cross-sells are measurements of customer loyalty. The more customers that repurchase, upgrade their existing purchasing with your business or expand their engagement with your company by adding more users or features, the better.
This is another way of measuring customer retention and growth. When these numbers are up, you are protecting and growing your recurring revenue. This reduces the pressure for new customer acquisition.
Net Promoter Score
Net Promoter Score (NPS) measures customer satisfaction. This feedback is typically gathered through a survey asking customers to rate their experience following an interaction with your business. This score is an aggregate measure of overall customer experience and a predictor of customer loyalty.
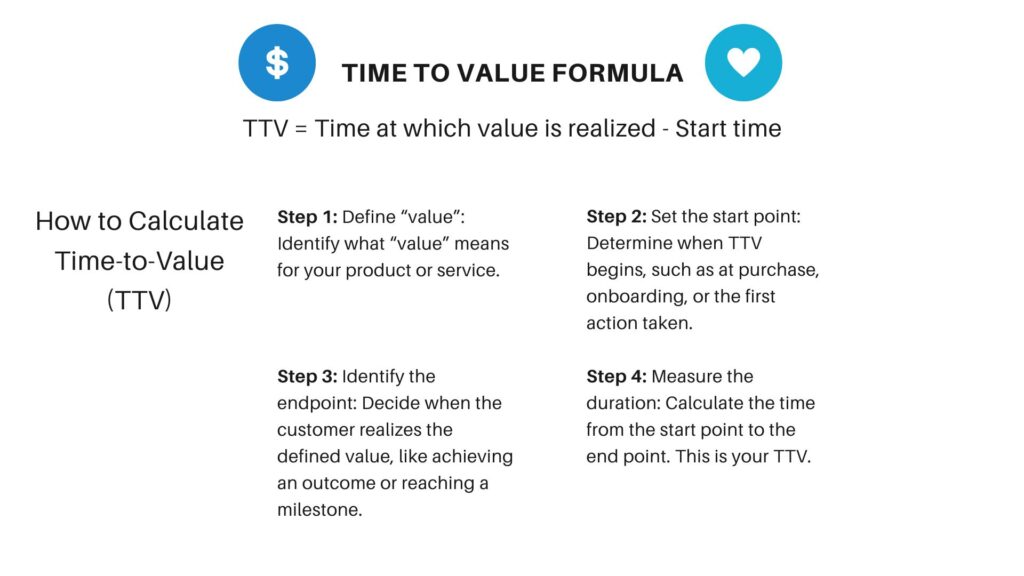
Time to Value
Time to Value (TTV) is how long it takes from the time of purchase for a customer to see results from using your product or service. A shorter TTV is important because it improves customer experience, builds trust by delivering on sales promises, and builds customer loyalty. Tracking this metric helps you gauge the effectiveness and efficiency of your customer onboarding and implementation processes.
Consumption/Usage/Adoption
The consumption, usage, or adoption rate measures the percentage of active customers versus the total number of customers. This metric shows you how actively customers are engaged with your products or services after they sign up. This helps you gauge product success and influences lifetime value, customer loyalty, and company revenue. A low product adoption rate can be a predictor of customer churn.
One additional best practice as to how to manage your metrics came at the suggestion of Seth London, Senior Director of Revenue Operations at Meltwater. Seth suggests building a go-to-market scorecard that spans all your commercial teams as follows:
“For the executive level, highlight the top 2-5 metrics per commercial team, and at the business unit level, go deeper, possibly using a dozen metrics for organizations like marketing. This gives you a platform to craft the high-level narrative for the executive leadership team and operationally with the business unit leaders.”
Revenue Metrics Dashboard Examples
A RevOps metrics dashboard is a centralized tool that visualizes key performance indicators (KPIs) to help teams monitor and optimize revenue processes. Here are some examples of dashboards and the metrics they might include:
1. Revenue Growth Dashboard
- Total Revenue: Monthly, quarterly, and yearly revenue.
- Revenue by Channel: Breakdown of revenue by sales, marketing, or partnerships.
- Customer Lifetime Value (CLV): Average revenue generated per customer over their lifecycle.
- Net Revenue Retention (NRR): Percentage of retained revenue after upsells, renewals, and churn.
2. Sales Performance Dashboard
- Quota Attainment: Percentage of sales reps meeting or exceeding their quotas.
- Win Rate: Percentage of deals closed out of total opportunities.
- Sales Cycle Length: Average time to close a deal.
- Pipeline Value: Total value of deals in the sales pipeline.
3. Marketing Efficiency Dashboard
- Lead Conversion Rates: Percentage of leads converting to opportunities or customers.
- Customer Acquisition Cost (CAC): Total cost of acquiring a customer.
- Marketing Qualified Leads (MQLs): Volume of leads meeting marketing-defined criteria.
- Return on Marketing Investment (ROMI): Revenue generated per dollar spent on marketing.
4. Customer Success Dashboard
- Customer Retention Rate: Percentage of customers retained over a period.
- Churn Rate: Percentage of customers lost during a specific timeframe.
- Expansion Revenue: Revenue gained through upsells or cross-sells.
- Net Promoter Score (NPS): Customer satisfaction and likelihood to recommend.
5. Forecasting and Predictive Dashboard
- Revenue Forecast: Predicted revenue for upcoming months or quarters.
- Deal Probability: Likelihood of deals closing based on historical data.
- Pipeline Velocity: Speed at which deals move through the sales process.
- Goal Tracking: Progress toward revenue and team-specific goals.
These dashboards can be built using tools like HubSpot, Salesforce, Tableau, or Looker, providing real-time insights for RevOps leaders to make data-driven decisions.
Start Tracking Your Revenue Operations
Identifying and monitoring the metrics that will best help you achieve your business goals is essential to business success. Consistently tracking the right metrics allows you to adjust your strategies accordingly for continuous improvement.
While there are many metrics to track, it’s best to identify one north star metric for all revenue units to focus on each quarter. This creates better team alignment and allows a cohesive effort toward attaining a shared goal. QuotaPath can guide comp plan designs that support the main metric and track, forecast, and report on attainment, earnings, and compensation plan performance and efficiency metrics.Schedule time with our team to learn more.
FAQs
What are RevOps KPIs?
RevOps KPIs are measurable indicators that track the performance and efficiency of revenue-generating processes across sales, marketing, and customer success. These KPIs, such as customer acquisition cost (CAC), customer lifetime value (CLV), net revenue retention (NRR), and sales cycle length, help organizations align teams, optimize workflows, and drive revenue growth. By focusing on these metrics, companies can make data-driven decisions to improve their overall revenue strategy.
How can MRR and ARR be increased?
MRR (Monthly Recurring Revenue) and ARR (Annual Recurring Revenue) can be increased by acquiring new customers, upselling or cross-selling to existing customers, and reducing churn rates. Improving product value, expanding into new markets, and offering tiered pricing or add-ons can also drive revenue growth. Additionally, optimizing customer success efforts and enhancing the onboarding experience help retain customers and encourage long-term commitments.
How to forecast revenue accurately?
To forecast revenue accurately, leverage historical data, analyze sales trends, and account for seasonality or market conditions. Use tools like CRM systems to track pipeline stages, deal probabilities, and sales velocity for predictive insights. Regularly update forecasts based on real-time data and involve cross-functional teams to ensure alignment and accuracy.
CLV vs CAC ratio
The CLV (Customer Lifetime Value) vs. CAC (Customer Acquisition Cost) ratio measures the profitability of acquiring customers by comparing the revenue a customer generates over their lifetime to the cost of acquiring them. A healthy ratio, typically 3:1 or higher, indicates efficient customer acquisition and strong long-term profitability. Monitoring and optimizing this ratio helps businesses balance growth and sustainability.