Are you asking Sales to fly blind? You wouldn’t try to fly a plane without the necessary data to follow the flight plan. But that’s what you do if you don’t have sales compensation dashboards.
A sales compensation dashboard is a visual display of your sales data in a readily accessible single view. It overviews commonly tracked key performance indicators (KPIs) and metrics such as quota attainment, average deal size, commission data, and compensation plan details.
A sales dashboard surfaces valuable information and insights for sales reps, management, leadership, and accounting. These dashboards are essential to guide users toward goal attainment, enable informed decisions, streamline operations, and inspire outstanding achievements.
See QuotaPath’s sales compensation dashboard
Provide a commissions source of truth for your entire team with dashboards fit for reps, admins, and executives.
Talk to SalesWhy sales compensation dashboards matter
Imagine a world without sales compensation dashboards — one where sales data is spread across multiple channels or spreadsheets, some password-protected.
Tracking progress, gathering insights, or getting answers to compensation questions would become a time-consuming wild-goose chase for reps and managers.
Unable to easily access sales data, leadership would be forced to piece together a view of team performance, wasting valuable time trying to identify and prioritize coaching requirements.
Discrepancies and misunderstandings around quota attainment and compensation accuracy would be commonplace as individuals waste valuable time manually tracking results. This would undoubtedly reduce trust and accountability, leading to costly rep turnover.
Uncertainty around progress toward goals, to the next compensation tier, or which deals to prioritize causes reps to become increasingly unmotivated and frustrated.
Ultimately, performance falls short, and business goals aren’t achieved.
That’s why sales compensation dashboards matter.
Key components
A sales comp dashboard consists of several essential elements, including:
| Sales performance metrics | Detailed information about the sales compensation plan and how a rep can earn commissions. |
| Commission earnings | Metrics used to track the sales commission earnings such as total commissions, average commission rate, and commission payout schedule. |
| Attainment to-date | Progress toward sales quota achievement |
| Forecasted earnings | Earnings based on projected sales results. |
| Forecasted attainment | Quota achievement based on projected sales results |
| Compensation plan details | Metrics are used to track the sales commission earnings such as total commissions, average commission rate, and commission payout schedule. |
| Drill down capabilities | Ability to gain deeper insights based on specific queries |
How top B2B teams run KPIs with dashboard visuals
According to McKinsey, top-quartile B2B sales organizations create business-specific guidance KPIs to focus on and direct seller activities, including:
-
- Real-time customer insights
-
- Pricing recommendation engines
-
- Customer churn predicting systems
Moreover, these companies bring this info and data to the forefront using dashboards and other tools so that teams discuss, collaborate, and address issues daily.
Benefits of using sales compensation dashboards
The advantages of using sales compensation dashboards include:
Improved visibility and transparency: Sales compensation software provides easy access to data and insights that clarify performance against plan and is broken down by comp plan component.
Greater trust and accountability: The ability to see performance and earnings breakdowns based on the compensation plan builds confidence in the plan, boosts understanding, and promotes responsibility for results.
Increased motivation: A clearer understanding of the workings of the compensation plan improves the effectiveness of the plan in terms of driving desired sales behaviors and business goal achievement.
Better decision-making: Sales leadership gains a clearer picture of sales performance compared to the plan, enabling them to draw more educated conclusions. These insights facilitate the comp plan design process as well. Reps also gain clarity, allowing them to prioritize where to focus their efforts for the best outcomes.
Easier coaching prioritization: Sales performance metrics by team and individual make it easier for managers to identify and prioritize coaching needs to boost performance.
Allows leadership to get a quick pulse on team and individual numbers: A sales compensation dashboard provides leadership with an at-a-glance snapshot of team and individual sales performance compared to plan.
Time savings: Sales dashboards consolidate all the necessary information in one view. This eliminates the need for shadow accounting to track individual or team performance. Data must no longer be pieced together from various platforms across the organization.
How to create an effective sales compensation dashboard
“When it comes to sales metrics, a tremendous amount of time is spent reviewing information that leaders can do very little to influence,” wrote Scott Edinger in the Harvard Business Review piece, “Are You Paying Attention to the Right Sales Metrics?”
That’s why it’s pivotal to review business metrics that are most meaningful to your team and leadership.
Here are some steps to ensure your sales dashboard includes what matters most.
Identify your goals
First, you want to determine what you want to achieve with your sales compensation dashboard. For example, do you want to improve visibility and transparency, increase motivation, or make better compensation decisions?
Choose the right metrics
Once you know your goals, you can start to identify the specific metrics and features you need to include in your dashboard.
The metrics that you decide to track on your sales compensation dashboard should be aligned with your sales compensation plan and your company’s overall business goals. Some common sales compensation metrics include:
- Sales performance metrics: For example, quota attainment, average deal size, customer churn rate
- Commission earnings metrics: Data such as total commission earnings, average commission rate, commission payout schedule
- Compensation plan details: A summary of the sales compensation plan, including the different components of the plan and how they are calculated.
Choose a dashboard tool
There are various sales compensation dashboard tools available; see our section below for more details.
Set up your dashboard
Once you have chosen a dashboard tool, you need to set up your dashboard. This includes adding metrics and features and configuring the dashboard to meet your requirements.
Test your dashboard
Once you’ve set up your dashboard, it is essential to test it to ensure it functions properly. Have sales reps and managers test the dashboard to confirm it meets their needs and is easy to use.
Deploy your dashboard
Once you have tested and refined your dashboard, you can introduce it to your sales team.
Additional tips
A few extra tips for creating an effective sales compensation dashboard include:
Make it easy to use: The sales compensation dashboard should be easy for sales reps and managers. The charts and graphs should be clear and concise, and the data should be easily interpreted.
Update it regularly: The sales compensation dashboard should be updated routinely with the latest data. This will ensure that sales reps and managers have the most up-to-date information on their performance and earnings.
Get feedback from users: It is essential to get rep feedback on the sales compensation dashboard to ensure it meets their needs. This feedback can improve the dashboard and make it more effective.
By following these tips, you can create an effective sales compensation dashboard that will help you to improve visibility and transparency, increase motivation, make better compensation decisions, and streamline processes for sales reps and managers.
Common metrics tracked
The specific metrics you track in your sales compensation dashboard will vary depending on your sales compensation plan and your company’s overall business goals. However, in the sales compensation analysis, you may want to track metrics like:
Sales performance metrics: These metrics track the sales team’s performance against their goals. Some typical sales performance metrics include:
- Quota attainment: Percentage of sales reps who have achieved their quotas.
- Average deal size: Average size of deals closed by the sales team.
- Customer churn rate: Percentage of customers who have canceled their subscriptions or stopped doing business with the company.
- Customer lifetime value: Total revenue that the company expects to generate from a customer over the lifetime of the relationship.
- Commission earnings metrics: These metrics track the sales team’s commission earnings. Some standard commission earnings metrics include:
- Total commission earnings: Total commission earnings for the sales team.
- Average commission rate: Percentage of sales revenue that sales reps earn in commissions.
- Commission payout schedule: How often sales reps are paid their commissions.
Compensation plan details: These metrics provide detailed information about the sales compensation plan and a breakdown of the different ways in which a rep can earn commissions. Some standard compensation plan details include:
- Base salary: The fixed salary that sales reps earn.
- Commissions: The variable pay that sales reps make based on their sales performance.
- Bonuses: One-time payments that sales reps earn for achieving specific goals.
- SPIFs: Incentives or rewards designed to drive specific sales behaviors to meet short-term goals.
Choosing the right sales compensation dashboard software
There are various sales compensation dashboard tools available. Some are cloud-based, while others are on-premises. When selecting sales compensation software, you should consider the following factors:
- Features: Does the tool have all of the features that you need? For example, real-time data, performance insights, tracking progress toward personal goals and quotas, and forecasting future earnings based on the pipeline. You may also want dashboards for different roles to minimize time wasted navigating the comp data they need most. Does it facilitate effortless communications to resolve compensation issues and eliminate confusion? Does it support the complexities of your compensation structure?
- Usability: Is the tool easy for sales reps and managers to use? Is the user interface intuitive?
- Integrations: Does the tool integrate with your CRM system and other sales tools? If so, is the integration effortless or does it require customization or a developer to make it work?
- Pricing: Is the tool affordable and transparent? Is there a free trial, a startup package, or implementation fees?
- Scalability: Can it grow with the team? If so, does the solution offer additional features to facilitate scaling the software across your organization?
Real-world examples of sales compensation dashboards
No two sales compensation dashboards are the same however, here are some real-world examples to help you create the ideal sales dashboard to meet your needs:
Sales Rep Dashboard
Give your reps a dashboard that enables them to track their performance. Dashboard reporting in this board includes key metrics such as open opportunities, number of deals in their pipeline, meetings booked, and forecasted revenue.
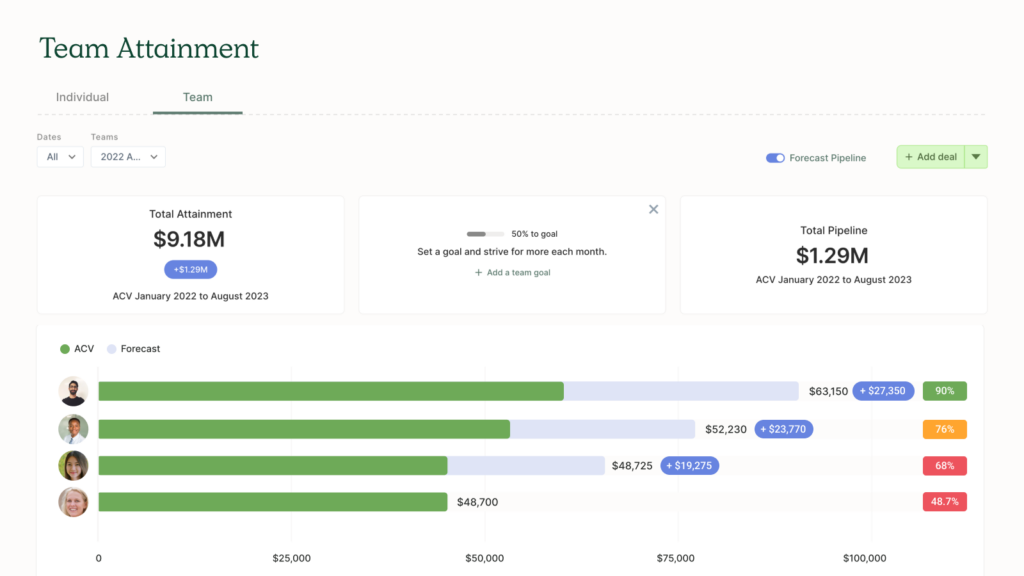
Sales Leaderboard
Tap into the competitive nature of your sales reps by using a sales leaderboard dashboard. Commonly displayed information shown on these dashboards includes the number of completed activities such as meetings, emails, or calls, customer retention numbers, generated MRR, and number of new accounts.
QuotaPath Admin Home
Our Admin Home dashboard provides clarity through a comprehensive view that delivers performance insights into essential compensation metrics and surfaces high-priority sales incentive management tasks.
These tasks include deals awaiting your approval or flagged commission discrepancies and payouts owed. This enables you to manage and keep current with commission-related activities efficiently.
The Admin Home view lets you view your team’s financial goals, total earnings, payouts, and effective rates and discern trends by filtering the data by month, quarter, or year.
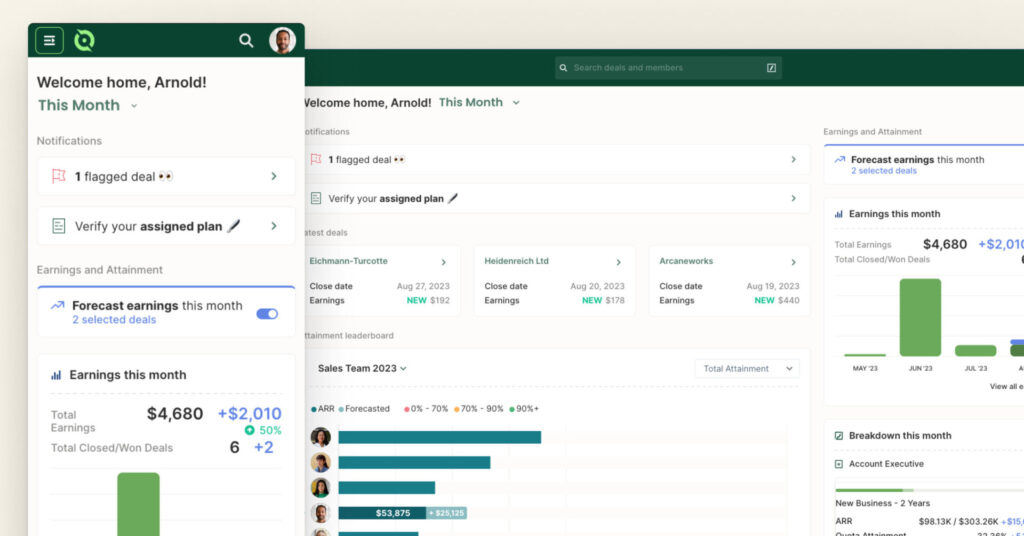
QuotaPath Rep Home
Our Home for Reps dashboard consolidates insights, tasks, and deal data history on one screen for easy viewing. This enables sellers to access an overview of earnings per month or quarter, plan payment breakdowns and payouts.
These insights promote accountability and ownership of their sales compensation. It enables them to get answers to their commission plan or payout questions by submitting their inquiry directly from their Home dashboard. This eliminates the need to jump through multiple hoops to get compensation answers.
This dashboard also gives reps an overview of their performance, forecasted earnings according to their pipeline, and task alerts. They can see a monthly breakdown of their performance against their comp plan broken down by comp plan components, such as bonuses, SPIFs, and accelerators.
Reps can add and track their progress toward personal financial goals like purchasing a car, making a down payment for a house, or saving up for a vacation.
Try the most collaborative solution to manage, track and payout variable compensation. Calculate commissions and pay your team accurately, and on time.
Start TrialStart leveraging sales compensation dashboards
Sales compensation dashboards are essential to streamline activities and achieve individual, team, and organizational goals. Otherwise, you lose visibility, transparency, trust, accountability, and motivation while inhibiting decision-making, coaching, and results.
Identify your goals, your metrics, and your sales compensation software. Then, set up your dashboard and test the deployment. Your organization will function more efficiently, and you’re more likely to meet or achieve your goals.
Looking for additional ways to boost your sales effectiveness? Schedule a chat with a team member to learn more about QuotaPath’s dashboards and sales compensation management, or start your free trial.