Revenue Capacity First, Quotas Second: An October Planning Framework for 2027
Most companies set quotas before they know what it takes to hit the number.
They’ll take last year’s target, add fifteen percent, and call it a day.
That’s what we in the biz refer to as… a wish.
Nobody checks it against pipeline capacity, sales cycle length, or how long a new AE actually takes to ramp.
Our latest blog is about the reverse order of operations.
First step: Size the plan from what growth requires. Then test whether the payout curve stays affordable across a bad quarter, a normal one, and a great one.
Do it in that order, and October planning produces a model.
But do it the other way, and October planning produces a guess with a deadline attached.
Start with the revenue and capacity model, not the quota
Nobody starts comp planning with a capacity model. Most start with last year’s number plus fifteen percent. The quota gets picked first, and the capacity to support it gets discovered later, usually in Q2, usually the hard way.
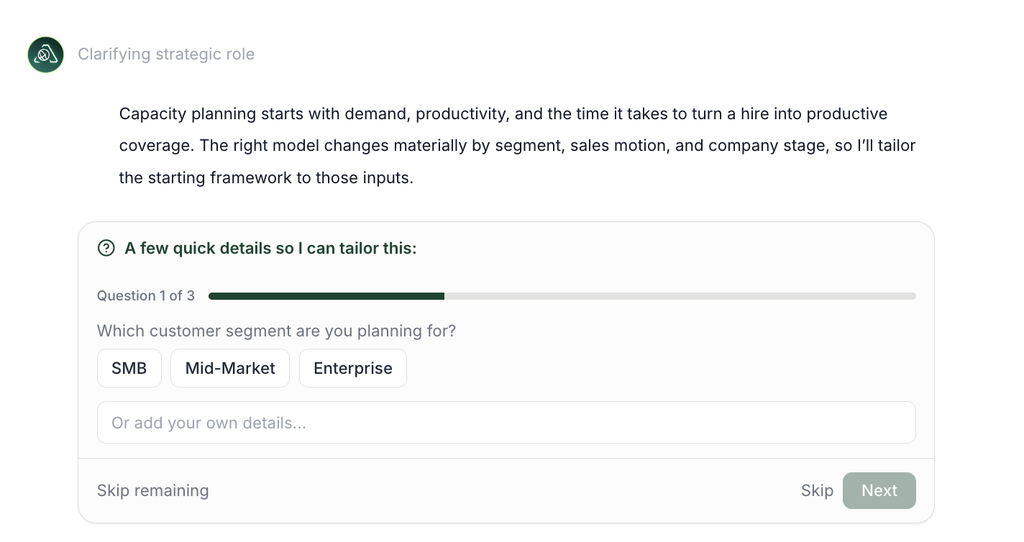
A quota is an output. It comes out of a capacity model, not a spreadsheet cell someone edits until the total feels right. Building that model for 2027 means answering a specific set of questions before assigning a single number to a single rep.
Start with the revenue targets themselves: new business, expansion, and renewal, broken out separately, because they carry different economics and different reps. Then the deal mechanics behind each one: average contract value, win rate, sales cycle length, and how many dollars of pipeline it takes to cover a dollar of bookings. From there, required bookings by quarter, with seasonality built in rather than smoothed away. A company that closes half its annual bookings in Q4 needs a comp plan and a hiring plan that account for that, not one that assumes twelve even months.
Then capacity, which is where most models fall apart. Ramp time for a new AE. How many months a rep is actually selling at full productivity once onboarding, training, and early pipeline-building are accounted for. What a realistic annual quota looks like given that ramp curve, not the quota that makes the spreadsheet balance. And headcount: how many AEs, AMs, and SDRs it takes to hit the target at that realistic productivity level, not the optimistic one.
A useful starting range for mid-market SaaS is an AE quota-to-OTE ratio of roughly 3.5–4.5x, based on Atlas’s benchmark data [INSERT: describe the underlying data set, e.g., “Atlas’s analysis of X,XXX mid-market SaaS AE plans”]. Treat it as a starting range to validate, not a rule to apply. Check it against the company’s own historical attainment and its actual pipeline capacity. A benchmark tells you where to start looking. It doesn’t tell you what’s true for this company, this year, this pipeline.
Fix the role economics before assigning individual numbers
Once the capacity model is built, the next mistake is treating quota-setting as an individual exercise, one rep at a time, one negotiation at a time. That produces a plan with fifteen versions of “the AE plan,” each slightly different because someone asked for a slightly better number in Q3 last year.
The fix is one standardized plan per role. OTE and quota vary by level or market. They don’t vary by who asked hardest.
| Role | Primary outcome | Planning focus |
|---|---|---|
| AE | New ARR / bookings | Quota, new-business rate, accelerators |
| Account Manager | Renewal and expansion | GRR/NRR ownership, renewal quota, expansion rate |
| SDR/BDR | Qualified pipeline | Meeting quality, accepted pipeline, sourced-won contribution |
Name what each role is actually paid to produce. An AE is paid to bring in new ARR. An account manager is paid to protect and grow the base, which means gross and net revenue retention own the plan before expansion does. An SDR is paid to produce qualified pipeline, not activity. Get the primary outcome right for each role and the planning focus underneath it follows directly. Get it wrong and every downstream decision, the quota, the rate, the accelerator, inherits the confusion.
Try the most collaborative solution to manage, track and payout variable compensation. Calculate commissions and pay your team accurately, and on time.
Start TrialTranslate strategy into a short list of incentive priorities
A comp plan that tries to reward everything rewards nothing well. The plan year fails at the design stage when it asks one AE plan to simultaneously drive new logos, upsell velocity, multi-year terms, and product attach, each with its own accelerator, each competing for the rep’s attention.
Pick a few measurable behaviors per role and build the plan around those.
For AEs, that typically means new-logo acquisition, penetration into a target segment, multi-year contract terms, and attach of a strategic product. Four is already a lot. Five starts diluting all of them.
For account managers, gross retention has to be paid before expansion, not alongside it as an equal priority. Expansion incentives without a retention floor create a specific trap: a rep can hit their expansion number on an account that’s quietly churning everywhere else, and the plan pays them for it. The number looks good. The account is dying.
For SDRs, balance meeting volume against what happens downstream, whether that’s accepted pipeline or closed-won contribution. Pay only on meetings booked and volume crowds out quality fast. A rep learns exactly how little qualification a meeting needs to count.
The rule underneath all three: one or two targeted accelerators, not incentives layered across every behavior the business cares about. A plan is a set of choices about what matters most this year. If it tries to say everything, it says nothing clearly enough for a rep to act on.
Pressure-test the plan against downside, plan, and upside
None of the above is finished until the cost is known, not just at target, but across the range of outcomes that could actually happen. This is where the CFO’s question gets answered before it gets asked.
Model three scenarios: downside at 70 to 80 percent attainment, plan at 100 percent, and upside at 120 to 130 percent. Run each one against the hiring and ramp timing from the capacity model, and against different mixes of new business, renewal, and expansion, since the mix shifts the payout curve even when total attainment doesn’t.
What does the plan cost if only seven in ten reps hit quota?
That’s not a rhetorical exercise. It’s the number that determines whether the plan is affordable in the scenario where the business needs it to be affordable most. At each scenario, review total variable compensation, cost of sales as a percentage of bookings, cash timing, and the percentage of reps expected to reach quota. A plan that looks reasonable at 100 percent attainment and turns unaffordable at 120 percent has a design flaw, not a forecasting problem. Comp isn’t approved until the cost is known across all three scenarios, not just the middle one.
What “done” looks like by end of October
October planning is finished when five things exist, not when the philosophy behind them is settled.
- Approved 2027 revenue and capacity assumptions.
- Draft quotas and OTE bands by role and level.
- Draft crediting rules for AE, AM, and SDR collaboration.
- Modeled payout curves for downside, plan, and upside cases.
- A short list of unresolved policy decisions for November approval.
That last item matters as much as the first four. Not every decision needs to be final in October. Some things, a specific accelerator threshold, a crediting edge case for split deals, are worth carrying into November as named open questions rather than forcing a premature answer in week one of planning.
Design, track, and manage variable incentives with QuotaPath. Give your RevOps, finance, and sales teams transparency into sales compensation.
Talk to SalesClosing the gap between the model and the number
Most comp plans get built once a year and left alone until something breaks. The capacity model above is a way to build the plan right the first time. What keeps it right is different: reviewing it quarterly against what actually happened, not just what was modeled in October.
That’s the part most RevOps teams don’t have the bandwidth to carry alone, and it’s also where Atlas earns its place in this process rather than just its name. Atlas pairs QuotaPath’s own benchmark data with a company’s real commission history, so the quota-to-OTE range from earlier isn’t the end of the conversation. It’s a starting point you can keep checking the plan against as attainment data comes in, quarter after quarter, instead of finding out in Q3 whether October’s assumptions held.
Start the capacity model this week. The quota can wait until the model says what it should be.