RevOps builds the capacity plan off a headcount target.
Finance builds the comp plan off a market OTE benchmark.
And nobody checks whether the two math problems share the same answer.
The best part? This mismatch usually doesn’t show up until the business is a quarter or two in, when it’s clear your sales funnel won’t mathematically funnel your quota… or your OTE is too rich for the deal size the team is closing. Perhaps an accelerator turns one rep’s good quarter into a commission expense line Finance didn’t plan for.
Each of these looks like a separate problem when it lands, but they’re the same problem: capacity and compensation weren’t built from the same model.
Below, we walk through how to build a revenue model built for both, that includes
- Productivity per rep
- Ramp time
- Quota
- Attainment distribution
- Cost of sales
We’ll use a mid-market, sales-led AE team as the working example in our model below. The team runs a 30- to 60-day sales cycle and carries mid-market deal sizes. Swap in your own cycle length, deal size, and win rate.
Note: The sequence holds regardless of segment or motion.
Why capacity plans and sales compensation plans break when they’re built apart
First, the default pattern. Capacity gets sized by how many seats the business wants to hire, and comp gets priced by what the market pays for that title. Two different owners, two different starting points, and no shared math.
RevOps feels this first.
They size the capacity model, and they hear about it when a rep’s quota doesn’t match what the pipeline can actually produce. HubSpot’s guidance on setting sales quotas makes the same point from the other direction: a quota only holds up if it’s built from a rep’s actual capacity and historical performance, not backed into from a top-down revenue target.
Finance feels it next, and differently.
For example, a CFO approves a commission expense on a plan they didn’t build the capacity assumptions for. So they’re kind of just approving the commission cost without approving or possibly seeing the productivity math that justifies the number.
That’s the gap this framework closes: capacity planning and comp planning start from the same rep productivity number (not two different ones).
Here are six steps to do so.
Design, track, and manage variable incentives with QuotaPath. Give your RevOps, finance, and sales teams transparency into sales compensation.
Talk to SalesStep 1: Define productive capacity per AE
Start with the quota a fully ramped AE can carry for the sales cycle length you’re actually running. For a 30- to 60-day mid-market cycle, that means working backward from a realistic deal count per quarter, not forward from a revenue target divided evenly across the team.
The funnel math is simple, and it’s where most capacity plans quietly go wrong:
Required pipeline = quota ÷ win rate
If a rep’s quota assumes a win rate the team has never actually hit, the pipeline coverage number that follows is wrong before the quarter starts. Build this off the team’s historical win rate.
The second correction is ramp.
A new hire isn’t a full-capacity unit on day one, and modeling them as one overstates what the team can actually produce. Separate ramped reps from ramping reps in the capacity math, and give the ramping cohort a lower productivity assumption until the data says otherwise.
In this example, a fully ramped mid-market AE is modeled at six to ten closed deals per quarter. That’s this scenario’s assumption, built from this team’s deal size and cycle length. Pull your own number from your own closed-won history before you use it to size a team.
Step 2: Set quota and OTE together
The second break happens when quota and OTE get set one after the other instead of together. RevOps sets quota. Finance backs into OTE. Or the reverse. Either way, the quota-to-OTE ratio becomes a byproduct of two separate decisions instead of a decision on its own.
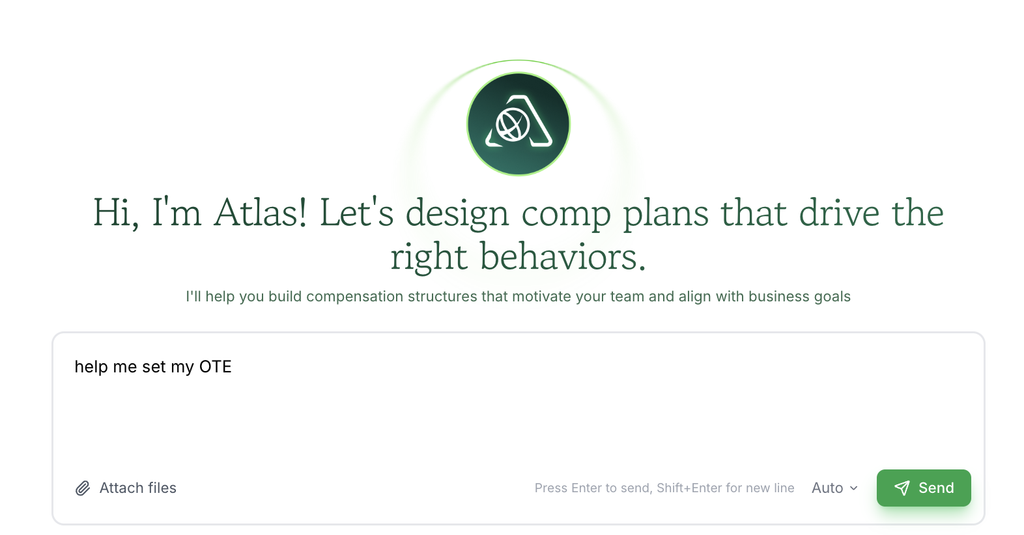
A common planning guardrail for mid-market teams in 2026 sits in the 3.5x to 4.5x quota-to-OTE range (Atlas, our AI revenue strategist, has the most recent benchmarking data on this).
Use that as a starting range to check your plan against, not a rule. In this example, a $160,000 OTE implies roughly $560,000 to $720,000 in annual quota, depending on where the plan lands in that range.
From there, the base commission rate is one calculation:
Base commission rate = target variable compensation ÷ annual quota
An $80,000 variable target on a $640,000 quota produces a 12.5% base rate. Walking the math this way means every number in the plan traces back to a decision someone made, instead of a rate copied from last year’s plan.
QuotaPath’s Quota:OTE Ratio Calculator does this math against your own numbers.
Step 3: Model the attainment curve instead of assuming 100%
Next, you have to model the attainment curve.
Most capacity plans quietly assume every rep hits 100% of quota. But let’s be real. None of them do. Planning as though they will overstates the bookings forecast and understates commission expense in the same move.
Build the plan from a distribution instead:
| AE category | Planning assumption |
|---|---|
| Ramp or below target | 50-75% attainment |
| Core productive AEs | 90-110% attainment |
| Top performers | 120-140% attainment |
This is the team’s own attainment history.
Gong’s research on quota attainment makes the same case: attainment distribution (not average attainment) predicts revenue, because a team can hit its average and still miss the mix the mix requires.
Use the weighted result of that distribution, not the sum of every rep’s quota, to forecast bookings and commission expense. That single change is what keeps a capacity plan from over-hiring against a theoretical number nobody on the current team has actually hit.
For the full breakdown of what counts as a strong attainment rate at each tier, see QuotaPath’s guide on quota attainment rate benchmarks.
Step 4: Price accelerators before you approve headcount (not after)
An accelerator is a cost-of-sales decision before it’s a motivation tool, and it should be priced like one.
Model commission expense at several attainment levels before the plan goes live: 70%, 100%, 120%, and 140% are a reasonable spread for most mid-market plans.
💡Use Atlas to model these comp design scenarios.
The failure mode here is specific: an accelerator that makes one rep’s exceptional quarter look great on a deal desk slide and lands as a finance surprise three weeks later because nobody modeled the cost at the top of the curve. The goal is an accelerator that makes incremental revenue genuinely attractive to the rep without making cost of sales unpredictable for the CFO approving the plan.
QuotaPath’s guide to designing motivational accelerator plans walks through structures that hit that balance.
Step 5: Count capacity in productive AE quarters
Remember that headcount is the wrong unit for capacity.
A roster of 10 reps rarely produces ten quarters of full productivity, once every drag on that number gets counted, like:
- Hiring and onboarding delay
- Reduced quota during ramp
- Time to full productivity
- Expected attrition and backfill time
- Territory or pipeline build time
This is usually where a mid-year miss actually started.
A plan sized for 10 reps that delivers only seven productive quarters, once you price in ramp and attrition, was never a 10-rep plan. It just looked like one on the org chart.
Ramp time in particular is a controllable variable, not a fixed cost. Gong’s onboarding research treats faster time-to-productivity as a lever the business can actually pull, not a constant to plan around.
The same logic applies to territory and pipeline build time. QuotaPath’s sales territory planning guide covers what shortens that runway.
Step 6: Review capacity and comp together, every quarter
Keep in mind that the model above is a starting point. What keeps capacity and comp aligned after the first quarter, when reality inevitably diverges from the plan, is a standing review against a small set of numbers:
- Attainment by cohort
- Pipeline coverage per AE
- Time to productivity
- Quota capacity versus the company’s revenue target
- Commission expense as a percentage of new ARR
- Percentage of AEs at 80% of quota or better
Review these together, in the same meeting, with RevOps, Finance, and Sales in the room. Reviewing capacity and comp separately is the pattern that broke the plan in the first place.
The takeaway
In summary, size AE capacity from productive quarterly output and expected attainment and avoid basing this number on assigned headcount.
Keep quota, OTE, accelerator exposure, and commission expense in the same operating model, reviewed on the same cadence.
That’s the whole discipline. Everything above is what it takes to actually run it.
Next steps
Now that you’ve got the playbook, we recommend putting it into action.
- Build a three-case model: base, downside, and upside, using your team’s actual ACV, win rate, sales cycle, ramp duration, and attrition assumptions.
- The output that matters is the number of productive AE quarters required to support the revenue plan, and the commission cost at each attainment level.
That’s the exact question Atlas, QuotaPath’s AI comp strategist, is built to model, using your own commission data instead of a generic benchmark.
Meet Atlas, see how capacity planning works inside QuotaPath, or begin building it out yourself in a 14-day trial with QuotaPath.