
An effective sales kickoff (SKO) promotes team collaboration, alignment, and motivation. Start this trend as you prepare for a successful sales kickoff with collaborative planning to align the entire go-to-market (GTM) team.
Cross-departmental collaboration gets all relevant parties on the same page and aligned with business, sales, and marketing goals. This allows key contributors to collectively decide on a relevant theme, plan the event, and create content that all ties back to the theme.
Gather input from the entire group, then leverage Marketing’s expertise for a more cohesive experience with consistent messaging.
What does SKO mean?
SKO meaning: SKO means sales kickoff. This is a special event for your entire go-to-market (GTM) team. This event occurs annually at the start of an organization’s new fiscal year. Its goal is to communicate business and individual strategies and objectives, recognize top performers, share knowledge, and motivate sellers.
Key departments that should be included in this collaborative effort include:
- Sales: Defining sales objectives, goals, and expectations
- Operation: Ensuring the logistical and technical aspects of the event run smoothly
- HR and Training: Addressing team-building activities and skill development sessions
- Marketing: Creating a compelling sales kickoff with engaging and consistent on-brand messaging, strategic guidance, and event creation and promotion expertise
Guide: Master Saleskickoff Excellence
Learn what it takes to strike success at your sales kickoff — including how to get your sales team hyped for the year ahead (and their new comp plans).
View GuideWhy Involve Marketing in Sales Kickoff Planning
It’s essential to involve Marketing in the SKO planning process. Aligning sales and marketing goals ensures a unified message and avoids confusion.
It makes sense to leverage Marketing’s expertise for effective event promotion and engagement. This builds excitement around the SKO event.
Plus, Marketing can enhance the overall branding and messaging strategy for the event through collaboration with the group.
Collaborative Sessions: Marketing’s Role in Sales Kickoff
Let’s explore some sessions to consider when adding Marketing to the SKO agenda.
Option #1 – Branding and Messaging Workshop:
A marketing-led workshop at a Sales Kickoff (SKO) focused on messaging alignment is a valuable opportunity to ensure the entire sales team is on the same page regarding the company’s messaging strategy.
Here’s an outline of what such a workshop might entail:
Title: Crafting a Unified Message: Marketing-Led SKO Workshop
This workshop fosters collaboration between the marketing and sales teams, ensuring a unified and compelling message that resonates with the target audience.
| Introduction | – Welcome and overview of the importance of unified messaging – Brief introduction of the workshop objectives and agenda |
| Understanding the Company’s Brand Identity | – Review of the company’s mission, vision, and values – Overview of the brand personality and key differentiators |
| Target Audience and Buyer Personas | – Discussion on defining and understanding target audiences – Breakout sessions to create detailed buyer personas for various segments |
| Current Messaging Assessment | – Evaluation of existing sales and marketing messages – Identification of strengths, weaknesses, opportunities, and threats in current messaging |
| Core Message Development | – Defining the core message: What does the company want to convey? – Collaborative exercises to craft a concise and impactful core message |
| Message Mapping | – Mapping the core message to different stages of the buyer’s journey – Aligning messaging with various customer touchpoints |
| Consistency Across Channels | – Ensuring consistency in messaging across different marketing channels – Discussion on adapting the message for various platforms and media |
| Interactive Exercise | – Role-playing scenarios: Applying the unified message in sales conversations – Crafting elevator pitches and responses to common objections |
| Case Studies and Examples | – Showcasing successful implementations of unified messaging in past campaigns – Analyzing case studies to understand the impact of consistent messaging |
| Alignment with Sales Goals | – Discussing how the unified message aligns with sales objectives – Mapping messaging to specific sales scenarios and goals |
| Feedback and Iteration | – Collecting feedback from participants on the crafted messaging – Iterative exercises for fine-tuning the message based on team input |
| Implementation Strategies | – Developing a plan for implementing the unified message post-SKO – Assigning responsibilities and roles for maintaining message consistency |
| Q&A and Open Discussion | – Providing an opportunity for participants to ask questions and seek clarification – Facilitating an open discussion on the importance of unified messaging |
| Wrap-up and Next Steps | – Summary of key takeaways – Communication of the next steps and ongoing support for message alignment |
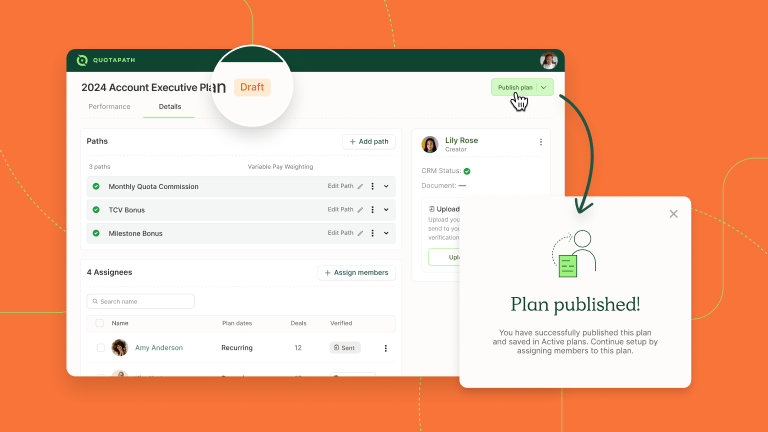
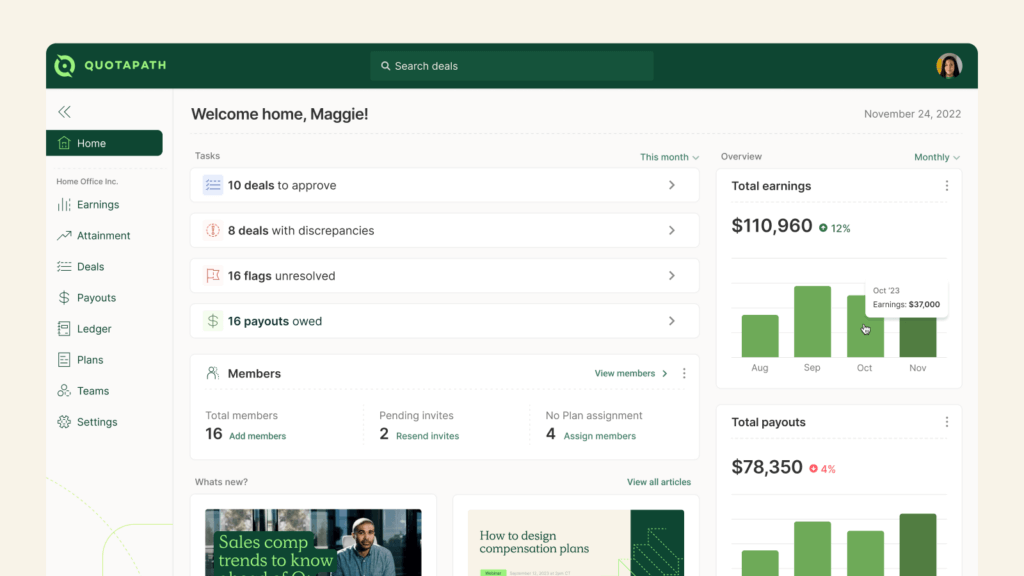
Design, track, and manage variable incentives with QuotaPath. Give your RevOps, finance, and sales teams transparency into sales compensation.
Talk to SalesOption #2 – Customer Personas and Target Audience Workshop:
This marketing-led workshop aims to empower the sales team with a deep understanding of their target audience through the creation and utilization of effective customer personas.
Title: Know Your Audience: Crafting Effective Customer Personas for Sales Success
| Introduction | – Welcome and overview of the workshop’s importance in understanding the target audience – Brief introduction of the workshop objectives and agenda |
| Importance of Customer Personas in Sales | – Explanation of how detailed customer personas contribute to sales success – Showcase of real-world examples where understanding personas led to successful sales strategies |
| Defining the Target Audience | – Interactive session on identifying the broader target audience – Overview of market segmentation and its relevance to persona development |
| Elements of Robust Customer Personas | – Detailed discussion on the key elements of effective customer personas: Demographics, psychographics, and firmographics – Pain points, challenges, and aspirations |
| Gathering Data for Personas | – Strategies for collecting and analyzing customer data – Best practices for conducting interviews, surveys, and utilizing analytics tools |
| Workshop Exercise: Creating Customer Personas | – Dividing participants into groups – Providing templates and guidance for crafting detailed customer personas |
| Aligning Personas with Sales Strategies | – Discussing how personas inform and influence the sales approach – Tailoring sales messaging, content, and strategies based on persona insights |
| Integrating Personas into Sales Tools | – Guidance on incorporating personas into CRM systems and other sales tools – Ensuring easy accessibility and utilization by the sales team |
| Iterative Persona Refinement | – Strategies for regularly updating and refining customer personas – Assigning responsibilities for maintaining persona accuracy |
| Wrap-up and New Steps | – Summary of key takeaways – Communication of the next steps and ongoing support for persona-driven sales strategies |
Option #3 – Product Roadmap Insights:
This product marketing-led workshop aims to empower the sales team with a deep understanding of the product roadmap, effective communication strategies, and alignment with upcoming milestones for successful sales outcomes.
Title: A Product Marketing Workshop for Sales Success
| Introduction | – Welcome and overview of the workshop’s role in product launches and sales success – Brief introduction of the workshop objectives and agenda |
| Understanding the Product | – In-depth exploration of the product or service being launched – Breakdown of key features, benefits, and unique selling propositions |
| Understanding the Product Roadmap | – Comprehensive overview of the current product roadmap – Breakdown of upcoming features, enhancements, and strategic initiatives |
| Target Audience and Buyer Personas Revisited | – Aligning the product roadmap with customer personas – Ensuring the roadmap addresses the evolving needs of the target audience |
| Crafting Sales Messaging Around Roadmap Milestones | – Techniques for integrating upcoming roadmap milestones into sales narratives – Utilizing roadmap insights to create compelling sales stories |
| Workshop Exercise: Roadmap Alignment and Message Crafting | – Dividing participants into groups – Providing templates and guidance for aligning sales messaging with upcoming roadmap features |
| Leveraging Roadmap for Competitive Advantage | – Discussing how the product roadmap positions the company competitively – Mapping roadmap milestones to address market needs and outpace competitors |
| Utilizing Sales Enablement Tools for Roadmap Communication | – Guidance on incorporating roadmap insights into sales enablement tools – Demonstrations of how to communicate roadmap updates to the sales team effectively |
| Anticipating and Addressing Customer Questions About the Roadmap | – Identifying potential questions and concerns from customers about the roadmap – Developing strategies for addressing customer inquiries with confidence |
| Q&A and Open Discussion | Providing an opportunity for participants to ask questions and seek clarificationFacilitating an open discussion on the importance of product marketing in navigating the product roadmap for sales success |
| Wrap-up and Next Steps | Summary of key takeawaysCommunication of the next steps and ongoing support for roadmap-driven sales strategies |
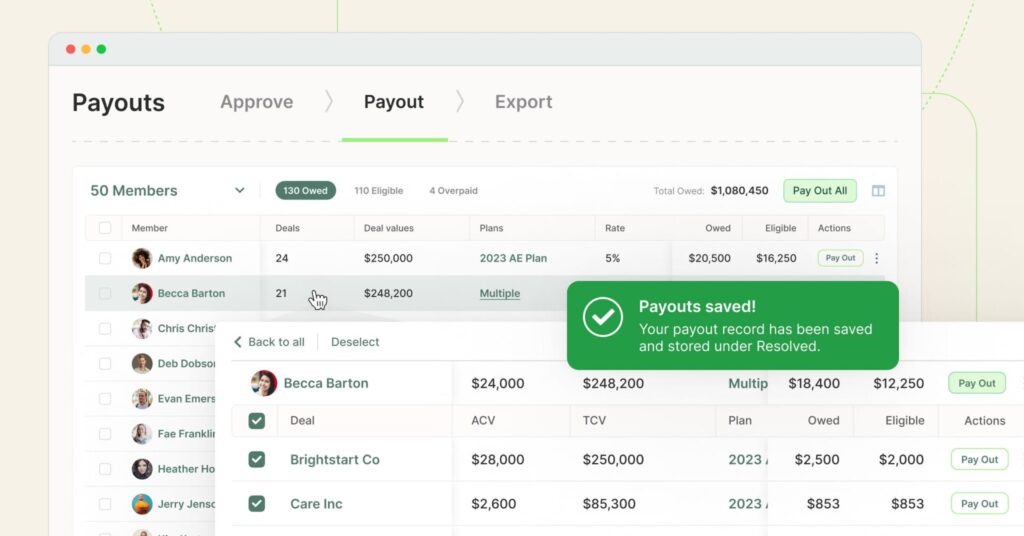
Try the most collaborative solution to manage, track and payout variable compensation. Calculate commissions and pay your team accurately, and on time.
Start TrialAdditional workshops to consider
Some additional workshop options you might add to your SKO agenda include:
- Unveiling new products or features: Guidance on how the sales team can effectively communicate these launches with interactive
- Demos and Workshops: Hands-on sessions showcasing marketing tools and resources plus collaboration between marketing and sales on effective demo strategies
- Content Strategy Roundtable: Discussing upcoming marketing campaigns and content strategy and gathering feedback from the sales team for future improvements
Measuring Impact and Feedback
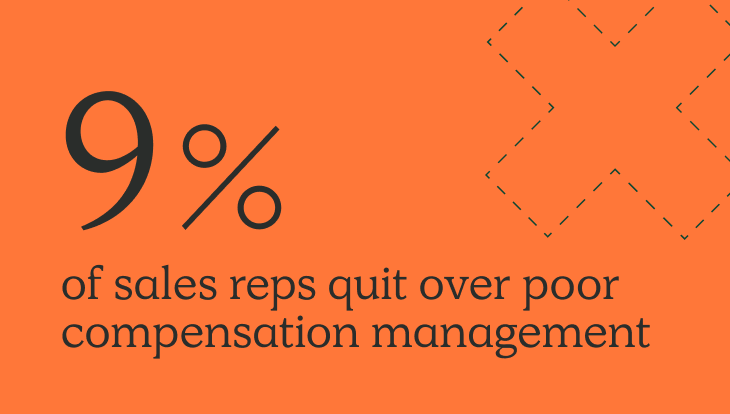
As you plan the SKO, remember to establish metrics to measure the success of your collaborative efforts. For example, you can look at lagging indicators such as deal velocity, deal size, and sales team turnover.
Then gather feedback from both sales and marketing teams for continuous improvement with anonymous surveys or questionnaires. These help you understand what worked well and what to adjust for future events.
Post-Event Integration Strategies
Once the event ends, integrate sales kickoff insights into ongoing marketing campaigns. Then conduct a collaborative debrief with the planning committee to identify successes and areas for improvement of future events.
Conclusion: Collaboratively plan your SKO with marketing
Marketing’s experience makes them valuable members of any SKO planning committee. They are adept at creating unified messaging, possess expertise in effective event promotion and engagement, and are most familiar with branding and messaging strategy.
With so much to contribute, it’s essential to include them on the team. Plus, sales and marketing are better when functioning collaboratively. So, consider SKO planning as a practice and continue working collaboratively moving forward for greater success.
About QuotaPath
QuotaPath is your trusted partner in streamlining and optimizing sales compensation. Whether rolling out new compensation plans at your SKO or enhancing ongoing commission tracking processes, QuotaPath empowers your sales teams, simplifies complexities, and ensures accuracy and transparency in commission payouts.
Schedule time with our team to learn more, or sign up for a free trial.


Recent Comments